Slovene vs Cheyenne Single Father Poverty
COMPARE
Slovene
Cheyenne
Single Father Poverty
Single Father Poverty Comparison
Slovenes
Cheyenne
17.3%
SINGLE FATHER POVERTY
0.3/ 100
METRIC RATING
264th/ 347
METRIC RANK
16.7%
SINGLE FATHER POVERTY
9.3/ 100
METRIC RATING
217th/ 347
METRIC RANK
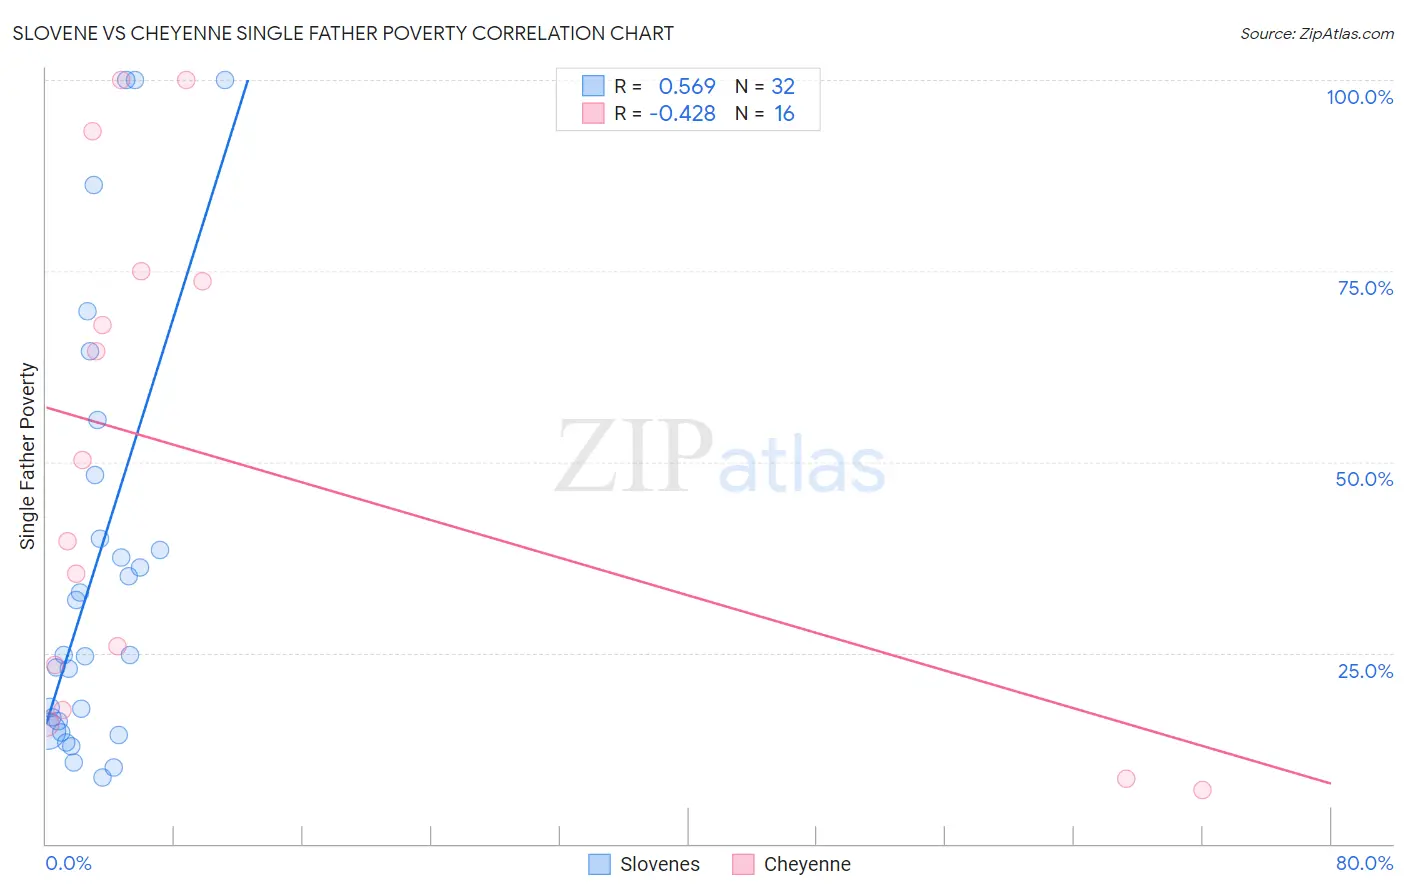
Slovene vs Cheyenne Single Father Poverty Correlation Chart
The statistical analysis conducted on geographies consisting of 209,649,531 people shows a substantial positive correlation between the proportion of Slovenes and poverty level among single fathers in the United States with a correlation coefficient (R) of 0.569 and weighted average of 17.3%. Similarly, the statistical analysis conducted on geographies consisting of 74,941,961 people shows a moderate negative correlation between the proportion of Cheyenne and poverty level among single fathers in the United States with a correlation coefficient (R) of -0.428 and weighted average of 16.7%, a difference of 3.7%.
Single Father Poverty Correlation Summary
| Measurement | Slovene | Cheyenne |
| Minimum | 8.6% | 7.0% |
| Maximum | 100.0% | 100.0% |
| Range | 91.4% | 93.0% |
| Mean | 36.3% | 49.9% |
| Median | 24.8% | 45.0% |
| Interquartile 25% (IQ1) | 15.4% | 20.4% |
| Interquartile 75% (IQ3) | 44.1% | 74.3% |
| Interquartile Range (IQR) | 28.7% | 53.9% |
| Standard Deviation (Sample) | 27.8% | 32.7% |
| Standard Deviation (Population) | 27.4% | 31.6% |
Similar Demographics by Single Father Poverty
Demographics Similar to Slovenes by Single Father Poverty
In terms of single father poverty, the demographic groups most similar to Slovenes are Polish (17.3%, a difference of 0.0%), Jamaican (17.3%, a difference of 0.060%), Haitian (17.3%, a difference of 0.10%), Lithuanian (17.3%, a difference of 0.20%), and Immigrants from Caribbean (17.4%, a difference of 0.20%).
| Demographics | Rating | Rank | Single Father Poverty |
| Immigrants | Albania | 0.7 /100 | #257 | Tragic 17.2% |
| Albanians | 0.7 /100 | #258 | Tragic 17.2% |
| Immigrants | Jamaica | 0.7 /100 | #259 | Tragic 17.2% |
| Spaniards | 0.6 /100 | #260 | Tragic 17.2% |
| Swiss | 0.5 /100 | #261 | Tragic 17.3% |
| Immigrants | Zaire | 0.4 /100 | #262 | Tragic 17.3% |
| Lithuanians | 0.4 /100 | #263 | Tragic 17.3% |
| Slovenes | 0.3 /100 | #264 | Tragic 17.3% |
| Poles | 0.3 /100 | #265 | Tragic 17.3% |
| Jamaicans | 0.3 /100 | #266 | Tragic 17.3% |
| Haitians | 0.3 /100 | #267 | Tragic 17.3% |
| Immigrants | Caribbean | 0.3 /100 | #268 | Tragic 17.4% |
| Slavs | 0.3 /100 | #269 | Tragic 17.4% |
| Indonesians | 0.2 /100 | #270 | Tragic 17.4% |
| French American Indians | 0.2 /100 | #271 | Tragic 17.4% |
Demographics Similar to Cheyenne by Single Father Poverty
In terms of single father poverty, the demographic groups most similar to Cheyenne are Immigrants from Scotland (16.7%, a difference of 0.030%), Immigrants from England (16.7%, a difference of 0.030%), Immigrants from Uganda (16.7%, a difference of 0.10%), Immigrants from Ghana (16.7%, a difference of 0.16%), and Spanish (16.7%, a difference of 0.17%).
| Demographics | Rating | Rank | Single Father Poverty |
| Guatemalans | 12.9 /100 | #210 | Poor 16.6% |
| Arabs | 12.8 /100 | #211 | Poor 16.6% |
| Immigrants | Southern Europe | 11.2 /100 | #212 | Poor 16.7% |
| Ghanaians | 11.0 /100 | #213 | Poor 16.7% |
| Spanish | 10.7 /100 | #214 | Poor 16.7% |
| Immigrants | Scotland | 9.6 /100 | #215 | Tragic 16.7% |
| Immigrants | England | 9.5 /100 | #216 | Tragic 16.7% |
| Cheyenne | 9.3 /100 | #217 | Tragic 16.7% |
| Immigrants | Uganda | 8.6 /100 | #218 | Tragic 16.7% |
| Immigrants | Ghana | 8.1 /100 | #219 | Tragic 16.7% |
| Immigrants | Denmark | 8.1 /100 | #220 | Tragic 16.7% |
| Immigrants | Greece | 8.1 /100 | #221 | Tragic 16.7% |
| Immigrants | Spain | 8.0 /100 | #222 | Tragic 16.7% |
| Immigrants | Austria | 7.0 /100 | #223 | Tragic 16.8% |
| Immigrants | Norway | 6.5 /100 | #224 | Tragic 16.8% |