Slovene vs Nepalese Male Poverty

COMPARE

Slovene
Race
Ancestry
AfghanAfricanAlaska NativeAlaskan AthabascanAlbanianAleutAlsatianAmericanApacheArabArapahoArgentineanArmenianAssyrian/Chaldean/SyriacAustralianAustrianBahamianBangladeshiBarbadianBasqueBelgianBelizeanBermudanBhutaneseBlackfeetBolivianBrazilianBritishBritish West IndianBulgarianBurmeseCajunCambodianCanadianCape VerdeanCarpatho RusynCelticCentral AmericanCentral American IndianCherokeeCheyenneChickasawChileanChineseChippewaChoctawColombianColvilleComancheCosta RicanCreeCreekCroatianCrowCubanCypriotCzechCzechoslovakianDanishDelawareDominicanDutchDutch West IndianEastern EuropeanEcuadorianEgyptianEnglishEstonianEthiopianEuropeanFijianFilipinoFinnishFrenchFrench American IndianFrench CanadianGermanGerman RussianGhanaianGreekGuamanian/ChamorroGuatemalanGuyaneseHaitianHmongHonduranHopiHoumaHungarianIcelanderIndian (Asian)IndonesianInupiatIranianIraqiIrishIroquoisIsraeliItalianJamaicanJapaneseJordanianKenyanKiowaKoreanLaotianLatvianLebaneseLiberianLithuanianLumbeeLuxembourgerMacedonianMalaysianMalteseMarshalleseMenomineeMexicanMexican American IndianMongolianMoroccanNative HawaiianNavajoNew ZealanderNicaraguanNigerianNorthern EuropeanNorwegianOkinawanOsageOttawaPaiutePakistaniPalestinianPanamanianParaguayanPennsylvania GermanPeruvianPimaPolishPortuguesePotawatomiPuebloPuerto RicanPuget Sound SalishRomanianRussianSalvadoranSamoanScandinavianScotch-IrishScottishSeminoleSenegaleseSerbianShoshoneSierra LeoneanSiouxSlavicSlovakSloveneSomaliSouth AfricanSouth AmericanSouth American IndianSoviet UnionSpaniardSpanishSpanish AmericanSpanish American IndianSri LankanSubsaharan AfricanSudaneseSwedishSwissSyrianTaiwaneseThaiTlingit-HaidaTohono O'OdhamTonganTrinidadian and TobagonianTsimshianTurkishU.S. Virgin IslanderUgandanUkrainianUruguayanUteVenezuelanVietnameseWelshWest IndianYakamaYaquiYugoslavianYumanYup'ikZimbabwean
Immigration
NonimmigrantsImmigrantsAfghanistanAfricaAlbaniaArgentinaArmeniaAsiaAustraliaAustriaBahamasBangladeshBarbadosBelarusBelgiumBelizeBoliviaBosnia and HerzegovinaBrazilBulgariaBurma/MyanmarCabo VerdeCambodiaCameroonCanadaCaribbeanCentral AmericaChileChinaColombiaCongoCosta RicaCroatiaCubaCzechoslovakiaDenmarkDominicaDominican RepublicEastern AfricaEastern AsiaEastern EuropeEcuadorEgyptEl SalvadorEnglandEritreaEthiopiaEuropeFijiFranceGermanyGhanaGreeceGrenadaGuatemalaGuyanaHaitiHondurasHong KongHungaryIndiaIndonesiaIranIraqIrelandIsraelItalyJamaicaJapanJordanKazakhstanKenyaKoreaKuwaitLaosLatin AmericaLatviaLebanonLiberiaLithuaniaMalaysiaMexicoMicronesiaMiddle AfricaMoldovaMoroccoNepalNetherlandsNicaraguaNigeriaNorth AmericaNorth MacedoniaNorthern AfricaNorthern EuropeNorwayOceaniaPakistanPanamaPeruPhilippinesPolandPortugalRomaniaRussiaSaudi ArabiaScotlandSenegalSerbiaSierra LeoneSingaporeSomaliaSouth AfricaSouth AmericaSouth Central AsiaSouth Eastern AsiaSouthern EuropeSpainSri LankaSt. Vincent and the GrenadinesSudanSwedenSwitzerlandSyriaTaiwanThailandTrinidad and TobagoTurkeyUgandaUkraineUruguayUzbekistanVenezuelaVietnamWest IndiesWestern AfricaWestern AsiaWestern EuropeYemenZaireZimbabweAzores
Nepalese
Race
Ancestry
AfghanAfricanAlaska NativeAlaskan AthabascanAlbanianAleutAlsatianAmericanApacheArabArapahoArgentineanArmenianAssyrian/Chaldean/SyriacAustralianAustrianBahamianBangladeshiBarbadianBasqueBelgianBelizeanBermudanBhutaneseBlackfeetBolivianBrazilianBritishBritish West IndianBulgarianBurmeseCajunCambodianCanadianCape VerdeanCarpatho RusynCelticCentral AmericanCentral American IndianCherokeeCheyenneChickasawChileanChineseChippewaChoctawColombianColvilleComancheCosta RicanCreeCreekCroatianCrowCubanCypriotCzechCzechoslovakianDanishDelawareDominicanDutchDutch West IndianEastern EuropeanEcuadorianEgyptianEnglishEstonianEthiopianEuropeanFijianFilipinoFinnishFrenchFrench American IndianFrench CanadianGermanGerman RussianGhanaianGreekGuamanian/ChamorroGuatemalanGuyaneseHaitianHmongHonduranHopiHoumaHungarianIcelanderIndian (Asian)IndonesianInupiatIranianIraqiIrishIroquoisIsraeliItalianJamaicanJapaneseJordanianKenyanKiowaKoreanLaotianLatvianLebaneseLiberianLithuanianLumbeeLuxembourgerMacedonianMalaysianMalteseMarshalleseMenomineeMexicanMexican American IndianMongolianMoroccanNative HawaiianNavajoNepaleseNew ZealanderNicaraguanNigerianNorthern EuropeanNorwegianOkinawanOsageOttawaPaiutePakistaniPalestinianPanamanianParaguayanPennsylvania GermanPeruvianPimaPolishPortuguesePotawatomiPuebloPuerto RicanPuget Sound SalishRomanianRussianSalvadoranSamoanScandinavianScotch-IrishScottishSeminoleSenegaleseSerbianShoshoneSierra LeoneanSiouxSlavicSlovakSomaliSouth AfricanSouth AmericanSouth American IndianSoviet UnionSpaniardSpanishSpanish AmericanSpanish American IndianSri LankanSubsaharan AfricanSudaneseSwedishSwissSyrianTaiwaneseThaiTlingit-HaidaTohono O'OdhamTonganTrinidadian and TobagonianTsimshianTurkishU.S. Virgin IslanderUgandanUkrainianUruguayanUteVenezuelanVietnameseWelshWest IndianYakamaYaquiYugoslavianYumanYup'ikZimbabwean
Immigration
NonimmigrantsImmigrantsAfghanistanAfricaAlbaniaArgentinaArmeniaAsiaAustraliaAustriaBahamasBangladeshBarbadosBelarusBelgiumBelizeBoliviaBosnia and HerzegovinaBrazilBulgariaBurma/MyanmarCabo VerdeCambodiaCameroonCanadaCaribbeanCentral AmericaChileChinaColombiaCongoCosta RicaCroatiaCubaCzechoslovakiaDenmarkDominicaDominican RepublicEastern AfricaEastern AsiaEastern EuropeEcuadorEgyptEl SalvadorEnglandEritreaEthiopiaEuropeFijiFranceGermanyGhanaGreeceGrenadaGuatemalaGuyanaHaitiHondurasHong KongHungaryIndiaIndonesiaIranIraqIrelandIsraelItalyJamaicaJapanJordanKazakhstanKenyaKoreaKuwaitLaosLatin AmericaLatviaLebanonLiberiaLithuaniaMalaysiaMexicoMicronesiaMiddle AfricaMoldovaMoroccoNepalNetherlandsNicaraguaNigeriaNorth AmericaNorth MacedoniaNorthern AfricaNorthern EuropeNorwayOceaniaPakistanPanamaPeruPhilippinesPolandPortugalRomaniaRussiaSaudi ArabiaScotlandSenegalSerbiaSierra LeoneSingaporeSomaliaSouth AfricaSouth AmericaSouth Central AsiaSouth Eastern AsiaSouthern EuropeSpainSri LankaSt. Vincent and the GrenadinesSudanSwedenSwitzerlandSyriaTaiwanThailandTrinidad and TobagoTurkeyUgandaUkraineUruguayUzbekistanVenezuelaVietnamWest IndiesWestern AfricaWestern AsiaWestern EuropeYemenZaireZimbabweAzores
Male Poverty
Income
Poverty
Unemployment
Labor Participation
Family Structure
Vehicle Availability
Education Level
Disability

Male Poverty Comparison

Slovenes

Nepalese

Exceptional
Tragic
10.0%
MALE POVERTY
98.8/ 100
METRIC RATING
49th/ 347
METRIC RANK
12.8%
MALE POVERTY
0.3/ 100
METRIC RATING
242nd/ 347
METRIC RANK

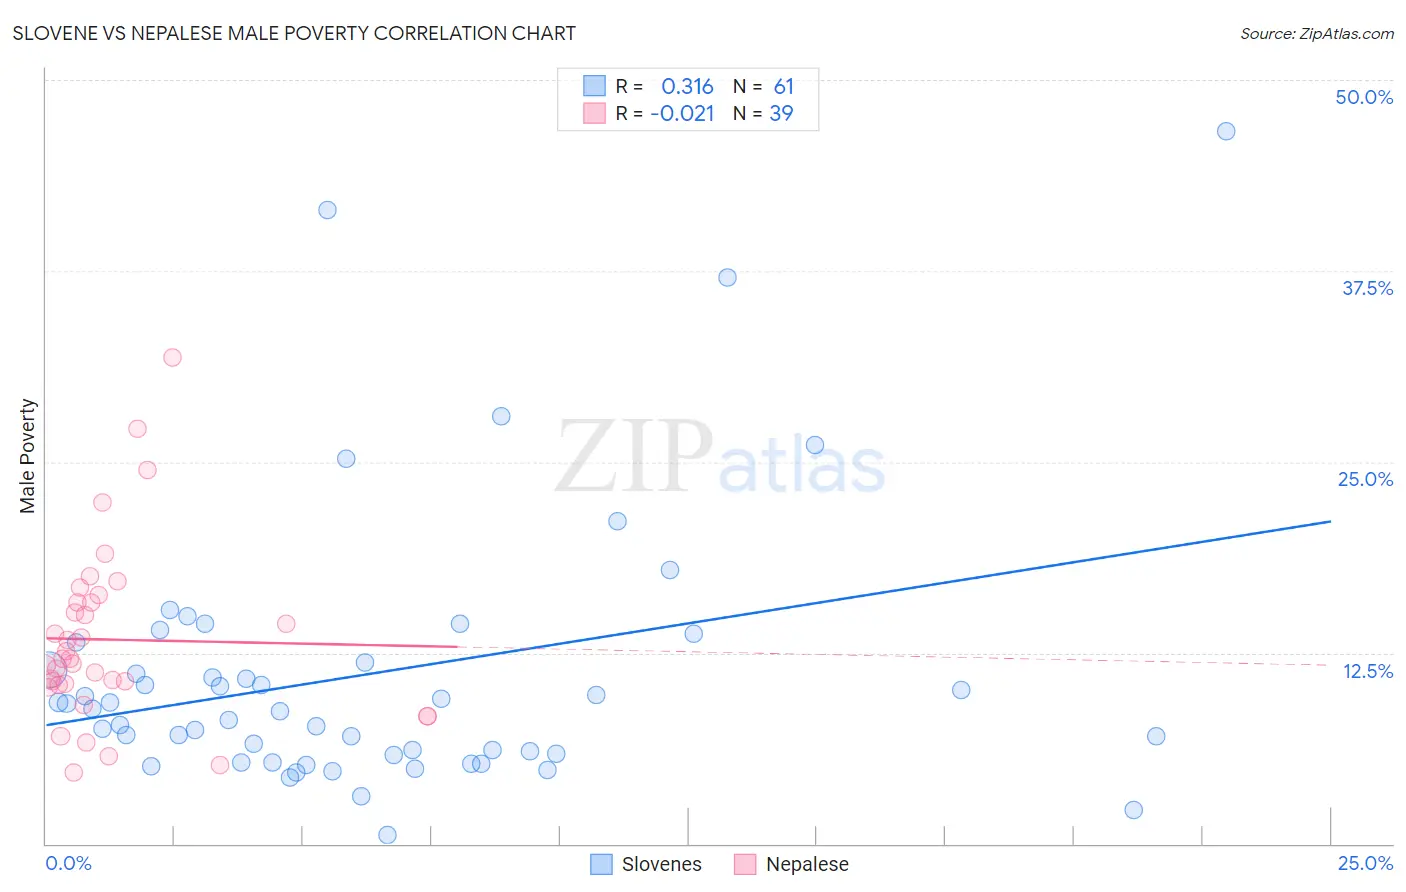
Slovene vs Nepalese Male Poverty Correlation Chart

The statistical analysis conducted on geographies consisting of 261,189,705 people shows a mild positive correlation between the proportion of Slovenes and poverty level among males in the United States with a correlation coefficient (R) of 0.316 and weighted average of 10.0%. Similarly, the statistical analysis conducted on geographies consisting of 24,519,269 people shows no correlation between the proportion of Nepalese and poverty level among males in the United States with a correlation coefficient (R) of -0.021 and weighted average of 12.8%, a difference of 28.0%.
Slovene vs Nepalese Male Poverty

Male Poverty Correlation Summary

MeasurementSloveneNepalese
Minimum0.61%4.7%
Maximum46.7%31.9%
Range46.1%27.2%
Mean11.1%13.4%
Median8.8%12.1%
Interquartile 25% (IQ1)5.8%10.4%
Interquartile 75% (IQ3)12.5%15.8%
Interquartile Range (IQR)6.7%5.4%
Standard Deviation (Sample)8.9%5.8%
Standard Deviation (Population)8.8%5.7%

Similar Demographics by Male Poverty

Demographics Similar to Slovenes by Male Poverty

In terms of male poverty, the demographic groups most similar to Slovenes are Immigrants from Philippines (10.0%, a difference of 0.050%), Immigrants from Singapore (10.0%, a difference of 0.090%), Immigrants from Japan (10.0%, a difference of 0.090%), Immigrants from Croatia (10.0%, a difference of 0.16%), and Turkish (10.0%, a difference of 0.23%).
DemographicsRating | RankMale Poverty
Immigrants | Iran
99.1
/100
|
#42
Exceptional
9.9%
Immigrants | Moldova
99.0
/100
|
#43
Exceptional
9.9%
Immigrants | Romania
98.9
/100
|
#44
Exceptional
9.9%
Immigrants | Serbia
98.9
/100
|
#45
Exceptional
10.0%
Turks
98.9
/100
|
#46
Exceptional
10.0%
Immigrants | Singapore
98.8
/100
|
#47
Exceptional
10.0%
Immigrants | Japan
98.8
/100
|
#48
Exceptional
10.0%
Slovenes
98.8
/100
|
#49
Exceptional
10.0%
Immigrants | Philippines
98.7
/100
|
#50
Exceptional
10.0%
Immigrants | Croatia
98.7
/100
|
#51
Exceptional
10.0%
Asians
98.7
/100
|
#52
Exceptional
10.0%
Immigrants | Czechoslovakia
98.6
/100
|
#53
Exceptional
10.0%
Immigrants | Austria
98.5
/100
|
#54
Exceptional
10.0%
Germans
98.3
/100
|
#55
Exceptional
10.1%
Immigrants | Bulgaria
98.2
/100
|
#56
Exceptional
10.1%

Demographics Similar to Nepalese by Male Poverty

In terms of male poverty, the demographic groups most similar to Nepalese are Alaskan Athabascan (12.8%, a difference of 0.040%), Tsimshian (12.8%, a difference of 0.14%), Liberian (12.8%, a difference of 0.16%), Sudanese (12.8%, a difference of 0.17%), and Immigrants from El Salvador (12.8%, a difference of 0.46%).
DemographicsRating | RankMale Poverty
Immigrants | Laos
0.5
/100
|
#235
Tragic
12.6%
Immigrants | Saudi Arabia
0.4
/100
|
#236
Tragic
12.7%
French American Indians
0.4
/100
|
#237
Tragic
12.7%
Ecuadorians
0.4
/100
|
#238
Tragic
12.7%
Ghanaians
0.4
/100
|
#239
Tragic
12.7%
Immigrants | Middle Africa
0.4
/100
|
#240
Tragic
12.7%
Sudanese
0.3
/100
|
#241
Tragic
12.8%
Nepalese
0.3
/100
|
#242
Tragic
12.8%
Alaskan Athabascans
0.3
/100
|
#243
Tragic
12.8%
Tsimshian
0.3
/100
|
#244
Tragic
12.8%
Liberians
0.3
/100
|
#245
Tragic
12.8%
Immigrants | El Salvador
0.2
/100
|
#246
Tragic
12.8%
Immigrants | Western Africa
0.2
/100
|
#247
Tragic
12.9%
Immigrants | Sudan
0.2
/100
|
#248
Tragic
12.9%
Potawatomi
0.2
/100
|
#249
Tragic
12.9%