Slovene vs Albanian Male Poverty
COMPARE
Slovene
Albanian
Male Poverty
Male Poverty Comparison
Slovenes
Albanians
10.0%
MALE POVERTY
98.8/ 100
METRIC RATING
49th/ 347
METRIC RANK
10.6%
MALE POVERTY
90.6/ 100
METRIC RATING
109th/ 347
METRIC RANK
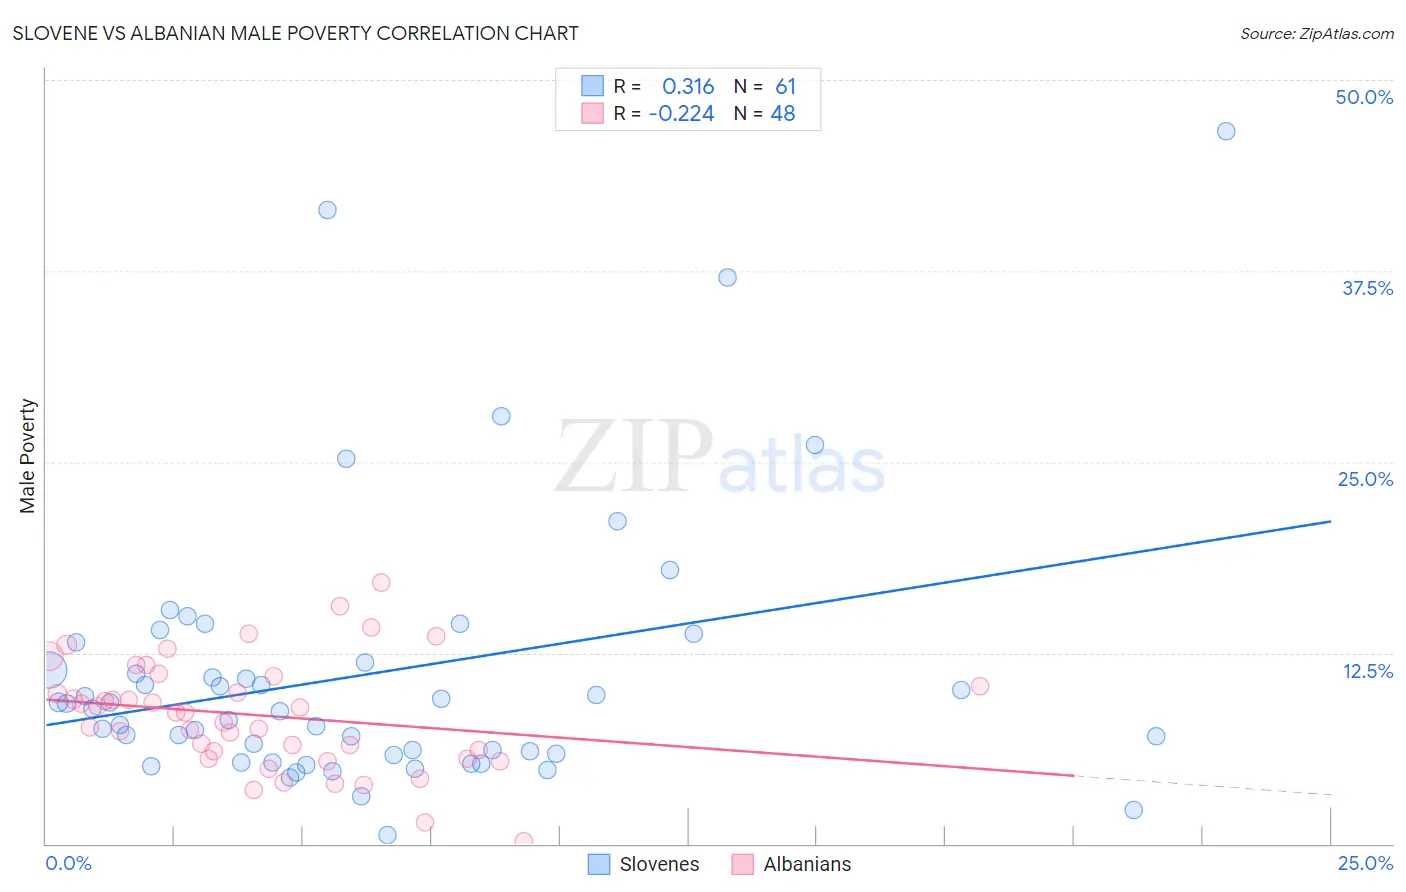
Slovene vs Albanian Male Poverty Correlation Chart
The statistical analysis conducted on geographies consisting of 261,189,705 people shows a mild positive correlation between the proportion of Slovenes and poverty level among males in the United States with a correlation coefficient (R) of 0.316 and weighted average of 10.0%. Similarly, the statistical analysis conducted on geographies consisting of 193,144,677 people shows a weak negative correlation between the proportion of Albanians and poverty level among males in the United States with a correlation coefficient (R) of -0.224 and weighted average of 10.6%, a difference of 5.8%.
Male Poverty Correlation Summary
| Measurement | Slovene | Albanian |
| Minimum | 0.61% | 0.15% |
| Maximum | 46.7% | 17.1% |
| Range | 46.1% | 17.0% |
| Mean | 11.1% | 8.4% |
| Median | 8.8% | 8.6% |
| Interquartile 25% (IQ1) | 5.8% | 5.8% |
| Interquartile 75% (IQ3) | 12.5% | 10.6% |
| Interquartile Range (IQR) | 6.7% | 4.8% |
| Standard Deviation (Sample) | 8.9% | 3.6% |
| Standard Deviation (Population) | 8.8% | 3.6% |
Similar Demographics by Male Poverty
Demographics Similar to Slovenes by Male Poverty
In terms of male poverty, the demographic groups most similar to Slovenes are Immigrants from Philippines (10.0%, a difference of 0.050%), Immigrants from Singapore (10.0%, a difference of 0.090%), Immigrants from Japan (10.0%, a difference of 0.090%), Immigrants from Croatia (10.0%, a difference of 0.16%), and Turkish (10.0%, a difference of 0.23%).
| Demographics | Rating | Rank | Male Poverty |
| Immigrants | Iran | 99.1 /100 | #42 | Exceptional 9.9% |
| Immigrants | Moldova | 99.0 /100 | #43 | Exceptional 9.9% |
| Immigrants | Romania | 98.9 /100 | #44 | Exceptional 9.9% |
| Immigrants | Serbia | 98.9 /100 | #45 | Exceptional 10.0% |
| Turks | 98.9 /100 | #46 | Exceptional 10.0% |
| Immigrants | Singapore | 98.8 /100 | #47 | Exceptional 10.0% |
| Immigrants | Japan | 98.8 /100 | #48 | Exceptional 10.0% |
| Slovenes | 98.8 /100 | #49 | Exceptional 10.0% |
| Immigrants | Philippines | 98.7 /100 | #50 | Exceptional 10.0% |
| Immigrants | Croatia | 98.7 /100 | #51 | Exceptional 10.0% |
| Asians | 98.7 /100 | #52 | Exceptional 10.0% |
| Immigrants | Czechoslovakia | 98.6 /100 | #53 | Exceptional 10.0% |
| Immigrants | Austria | 98.5 /100 | #54 | Exceptional 10.0% |
| Germans | 98.3 /100 | #55 | Exceptional 10.1% |
| Immigrants | Bulgaria | 98.2 /100 | #56 | Exceptional 10.1% |
Demographics Similar to Albanians by Male Poverty
In terms of male poverty, the demographic groups most similar to Albanians are Portuguese (10.6%, a difference of 0.13%), Argentinean (10.6%, a difference of 0.13%), Immigrants from Southern Europe (10.5%, a difference of 0.21%), Laotian (10.5%, a difference of 0.21%), and Immigrants from Argentina (10.6%, a difference of 0.24%).
| Demographics | Rating | Rank | Male Poverty |
| French Canadians | 91.9 /100 | #102 | Exceptional 10.5% |
| Slavs | 91.7 /100 | #103 | Exceptional 10.5% |
| Welsh | 91.6 /100 | #104 | Exceptional 10.5% |
| Canadians | 91.6 /100 | #105 | Exceptional 10.5% |
| Immigrants | Southern Europe | 91.3 /100 | #106 | Exceptional 10.5% |
| Laotians | 91.2 /100 | #107 | Exceptional 10.5% |
| Portuguese | 91.0 /100 | #108 | Exceptional 10.6% |
| Albanians | 90.6 /100 | #109 | Exceptional 10.6% |
| Argentineans | 90.1 /100 | #110 | Exceptional 10.6% |
| Immigrants | Argentina | 89.8 /100 | #111 | Excellent 10.6% |
| Immigrants | Turkey | 89.5 /100 | #112 | Excellent 10.6% |
| Palestinians | 89.1 /100 | #113 | Excellent 10.6% |
| Immigrants | Brazil | 89.0 /100 | #114 | Excellent 10.6% |
| Immigrants | Russia | 88.6 /100 | #115 | Excellent 10.6% |
| Sri Lankans | 88.1 /100 | #116 | Excellent 10.6% |