Ugandan vs Nepalese Male Poverty
COMPARE
Ugandan
Nepalese
Male Poverty
Male Poverty Comparison
Ugandans
Nepalese
12.2%
MALE POVERTY
2.2/ 100
METRIC RATING
221st/ 347
METRIC RANK
12.8%
MALE POVERTY
0.3/ 100
METRIC RATING
242nd/ 347
METRIC RANK
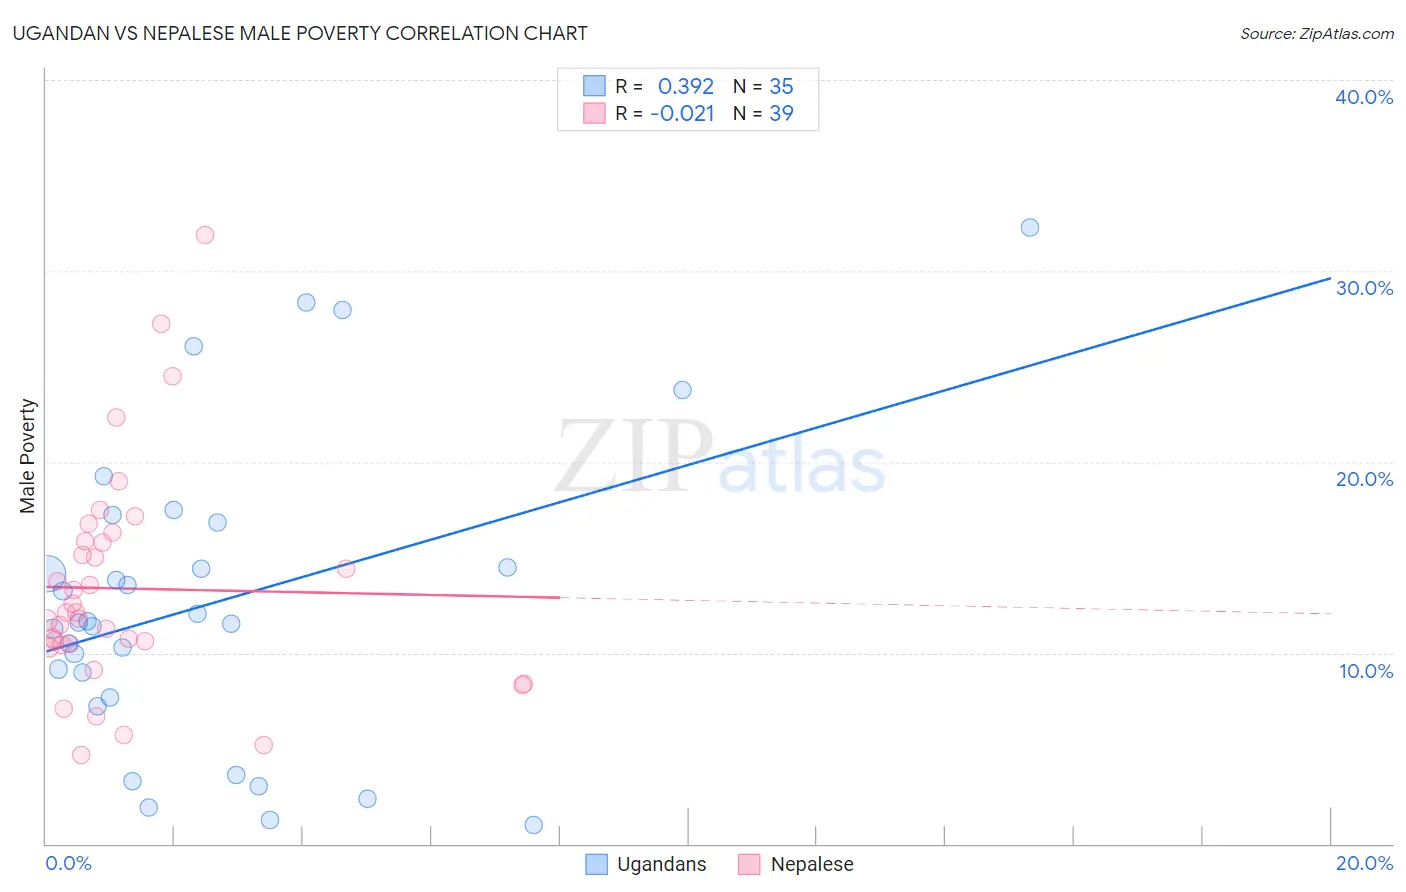
Ugandan vs Nepalese Male Poverty Correlation Chart
The statistical analysis conducted on geographies consisting of 93,987,101 people shows a mild positive correlation between the proportion of Ugandans and poverty level among males in the United States with a correlation coefficient (R) of 0.392 and weighted average of 12.2%. Similarly, the statistical analysis conducted on geographies consisting of 24,519,269 people shows no correlation between the proportion of Nepalese and poverty level among males in the United States with a correlation coefficient (R) of -0.021 and weighted average of 12.8%, a difference of 4.5%.
Male Poverty Correlation Summary
| Measurement | Ugandan | Nepalese |
| Minimum | 0.96% | 4.7% |
| Maximum | 32.3% | 31.9% |
| Range | 31.3% | 27.2% |
| Mean | 12.6% | 13.4% |
| Median | 11.6% | 12.1% |
| Interquartile 25% (IQ1) | 7.6% | 10.4% |
| Interquartile 75% (IQ3) | 16.8% | 15.8% |
| Interquartile Range (IQR) | 9.2% | 5.4% |
| Standard Deviation (Sample) | 7.9% | 5.8% |
| Standard Deviation (Population) | 7.8% | 5.7% |
Similar Demographics by Male Poverty
Demographics Similar to Ugandans by Male Poverty
In terms of male poverty, the demographic groups most similar to Ugandans are Immigrants from Africa (12.2%, a difference of 0.020%), Immigrants from Micronesia (12.2%, a difference of 0.040%), Immigrants from Eritrea (12.2%, a difference of 0.21%), Bermudan (12.2%, a difference of 0.23%), and German Russian (12.2%, a difference of 0.29%).
| Demographics | Rating | Rank | Male Poverty |
| Japanese | 2.7 /100 | #214 | Tragic 12.2% |
| Immigrants | Uzbekistan | 2.6 /100 | #215 | Tragic 12.2% |
| Immigrants | Cambodia | 2.5 /100 | #216 | Tragic 12.2% |
| Immigrants | Thailand | 2.5 /100 | #217 | Tragic 12.2% |
| German Russians | 2.5 /100 | #218 | Tragic 12.2% |
| Bermudans | 2.4 /100 | #219 | Tragic 12.2% |
| Immigrants | Eritrea | 2.4 /100 | #220 | Tragic 12.2% |
| Ugandans | 2.2 /100 | #221 | Tragic 12.2% |
| Immigrants | Africa | 2.1 /100 | #222 | Tragic 12.2% |
| Immigrants | Micronesia | 2.1 /100 | #223 | Tragic 12.2% |
| Immigrants | Nigeria | 1.6 /100 | #224 | Tragic 12.3% |
| Osage | 1.5 /100 | #225 | Tragic 12.3% |
| Nigerians | 1.4 /100 | #226 | Tragic 12.3% |
| Alaska Natives | 1.4 /100 | #227 | Tragic 12.4% |
| Alsatians | 1.3 /100 | #228 | Tragic 12.4% |
Demographics Similar to Nepalese by Male Poverty
In terms of male poverty, the demographic groups most similar to Nepalese are Alaskan Athabascan (12.8%, a difference of 0.040%), Tsimshian (12.8%, a difference of 0.14%), Liberian (12.8%, a difference of 0.16%), Sudanese (12.8%, a difference of 0.17%), and Immigrants from El Salvador (12.8%, a difference of 0.46%).
| Demographics | Rating | Rank | Male Poverty |
| Immigrants | Laos | 0.5 /100 | #235 | Tragic 12.6% |
| Immigrants | Saudi Arabia | 0.4 /100 | #236 | Tragic 12.7% |
| French American Indians | 0.4 /100 | #237 | Tragic 12.7% |
| Ecuadorians | 0.4 /100 | #238 | Tragic 12.7% |
| Ghanaians | 0.4 /100 | #239 | Tragic 12.7% |
| Immigrants | Middle Africa | 0.4 /100 | #240 | Tragic 12.7% |
| Sudanese | 0.3 /100 | #241 | Tragic 12.8% |
| Nepalese | 0.3 /100 | #242 | Tragic 12.8% |
| Alaskan Athabascans | 0.3 /100 | #243 | Tragic 12.8% |
| Tsimshian | 0.3 /100 | #244 | Tragic 12.8% |
| Liberians | 0.3 /100 | #245 | Tragic 12.8% |
| Immigrants | El Salvador | 0.2 /100 | #246 | Tragic 12.8% |
| Immigrants | Western Africa | 0.2 /100 | #247 | Tragic 12.9% |
| Immigrants | Sudan | 0.2 /100 | #248 | Tragic 12.9% |
| Potawatomi | 0.2 /100 | #249 | Tragic 12.9% |