Blackfeet vs Cheyenne Single Father Poverty
COMPARE
Blackfeet
Cheyenne
Single Father Poverty
Single Father Poverty Comparison
Blackfeet
Cheyenne
18.5%
SINGLE FATHER POVERTY
0.0/ 100
METRIC RATING
305th/ 347
METRIC RANK
16.7%
SINGLE FATHER POVERTY
9.3/ 100
METRIC RATING
217th/ 347
METRIC RANK
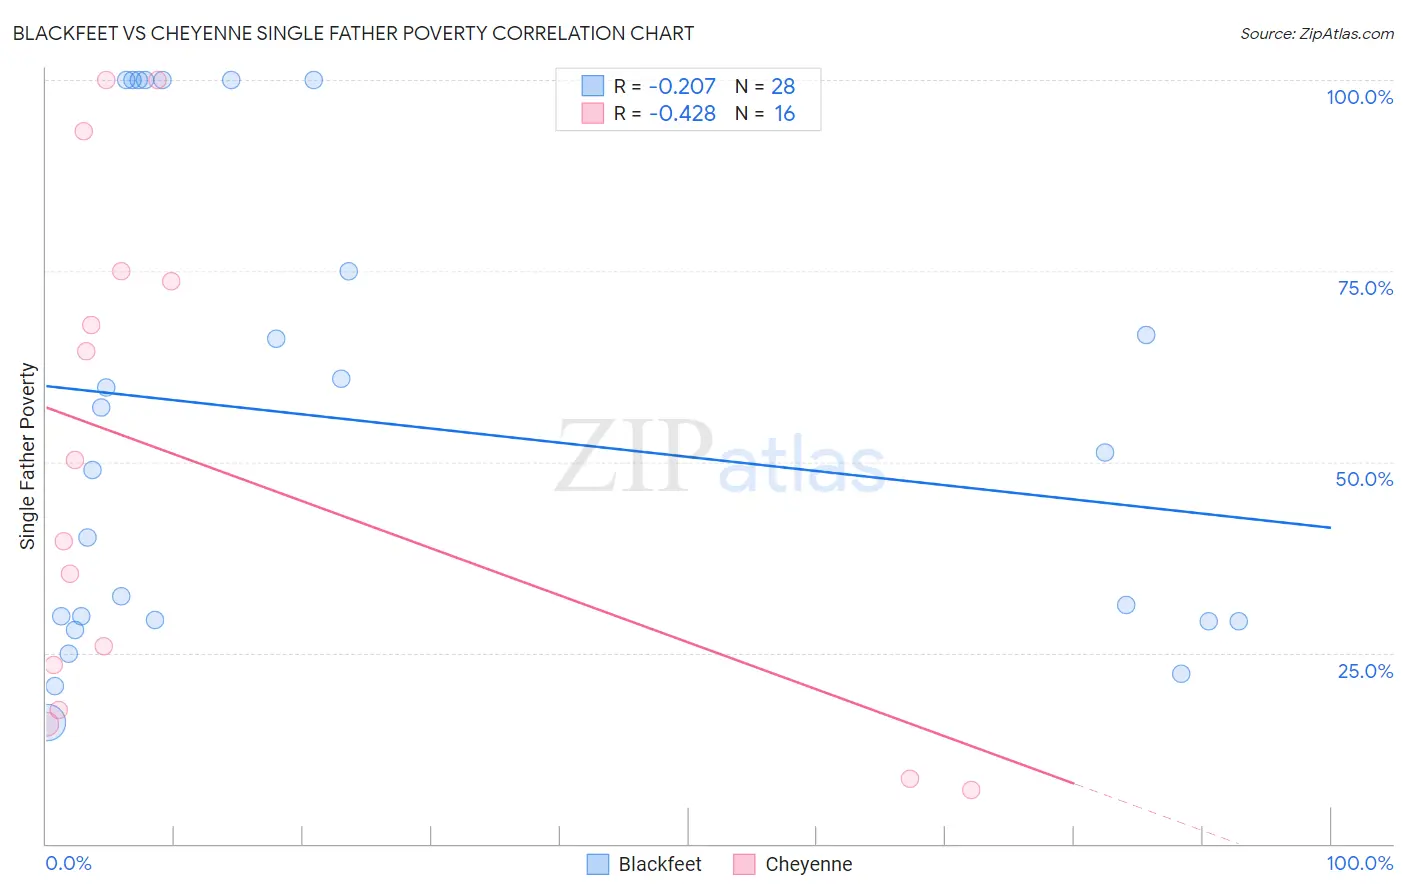
Blackfeet vs Cheyenne Single Father Poverty Correlation Chart
The statistical analysis conducted on geographies consisting of 259,730,501 people shows a weak negative correlation between the proportion of Blackfeet and poverty level among single fathers in the United States with a correlation coefficient (R) of -0.207 and weighted average of 18.5%. Similarly, the statistical analysis conducted on geographies consisting of 74,941,961 people shows a moderate negative correlation between the proportion of Cheyenne and poverty level among single fathers in the United States with a correlation coefficient (R) of -0.428 and weighted average of 16.7%, a difference of 10.8%.
Single Father Poverty Correlation Summary
| Measurement | Blackfeet | Cheyenne |
| Minimum | 15.8% | 7.0% |
| Maximum | 100.0% | 100.0% |
| Range | 84.2% | 93.0% |
| Mean | 55.3% | 49.9% |
| Median | 50.0% | 45.0% |
| Interquartile 25% (IQ1) | 29.2% | 20.4% |
| Interquartile 75% (IQ3) | 87.5% | 74.3% |
| Interquartile Range (IQR) | 58.3% | 53.9% |
| Standard Deviation (Sample) | 30.4% | 32.7% |
| Standard Deviation (Population) | 29.8% | 31.6% |
Similar Demographics by Single Father Poverty
Demographics Similar to Blackfeet by Single Father Poverty
In terms of single father poverty, the demographic groups most similar to Blackfeet are Ute (18.5%, a difference of 0.050%), Celtic (18.5%, a difference of 0.19%), Scotch-Irish (18.6%, a difference of 0.22%), Comanche (18.5%, a difference of 0.23%), and French Canadian (18.6%, a difference of 0.26%).
| Demographics | Rating | Rank | Single Father Poverty |
| Africans | 0.0 /100 | #298 | Tragic 18.3% |
| Whites/Caucasians | 0.0 /100 | #299 | Tragic 18.4% |
| Immigrants | Dominican Republic | 0.0 /100 | #300 | Tragic 18.4% |
| Hungarians | 0.0 /100 | #301 | Tragic 18.5% |
| Comanche | 0.0 /100 | #302 | Tragic 18.5% |
| Celtics | 0.0 /100 | #303 | Tragic 18.5% |
| Ute | 0.0 /100 | #304 | Tragic 18.5% |
| Blackfeet | 0.0 /100 | #305 | Tragic 18.5% |
| Scotch-Irish | 0.0 /100 | #306 | Tragic 18.6% |
| French Canadians | 0.0 /100 | #307 | Tragic 18.6% |
| Ottawa | 0.0 /100 | #308 | Tragic 18.6% |
| Immigrants | Micronesia | 0.0 /100 | #309 | Tragic 18.6% |
| Chippewa | 0.0 /100 | #310 | Tragic 18.8% |
| Immigrants | Nonimmigrants | 0.0 /100 | #311 | Tragic 18.8% |
| Immigrants | Dominica | 0.0 /100 | #312 | Tragic 18.9% |
Demographics Similar to Cheyenne by Single Father Poverty
In terms of single father poverty, the demographic groups most similar to Cheyenne are Immigrants from Scotland (16.7%, a difference of 0.030%), Immigrants from England (16.7%, a difference of 0.030%), Immigrants from Uganda (16.7%, a difference of 0.10%), Immigrants from Ghana (16.7%, a difference of 0.16%), and Spanish (16.7%, a difference of 0.17%).
| Demographics | Rating | Rank | Single Father Poverty |
| Guatemalans | 12.9 /100 | #210 | Poor 16.6% |
| Arabs | 12.8 /100 | #211 | Poor 16.6% |
| Immigrants | Southern Europe | 11.2 /100 | #212 | Poor 16.7% |
| Ghanaians | 11.0 /100 | #213 | Poor 16.7% |
| Spanish | 10.7 /100 | #214 | Poor 16.7% |
| Immigrants | Scotland | 9.6 /100 | #215 | Tragic 16.7% |
| Immigrants | England | 9.5 /100 | #216 | Tragic 16.7% |
| Cheyenne | 9.3 /100 | #217 | Tragic 16.7% |
| Immigrants | Uganda | 8.6 /100 | #218 | Tragic 16.7% |
| Immigrants | Ghana | 8.1 /100 | #219 | Tragic 16.7% |
| Immigrants | Denmark | 8.1 /100 | #220 | Tragic 16.7% |
| Immigrants | Greece | 8.1 /100 | #221 | Tragic 16.7% |
| Immigrants | Spain | 8.0 /100 | #222 | Tragic 16.7% |
| Immigrants | Austria | 7.0 /100 | #223 | Tragic 16.8% |
| Immigrants | Norway | 6.5 /100 | #224 | Tragic 16.8% |