Shoshone vs Immigrants from Haiti Male Poverty
COMPARE
Shoshone
Immigrants from Haiti
Male Poverty
Male Poverty Comparison
Shoshone
Immigrants from Haiti
13.8%
MALE POVERTY
0.0/ 100
METRIC RATING
286th/ 347
METRIC RANK
13.8%
MALE POVERTY
0.0/ 100
METRIC RATING
284th/ 347
METRIC RANK
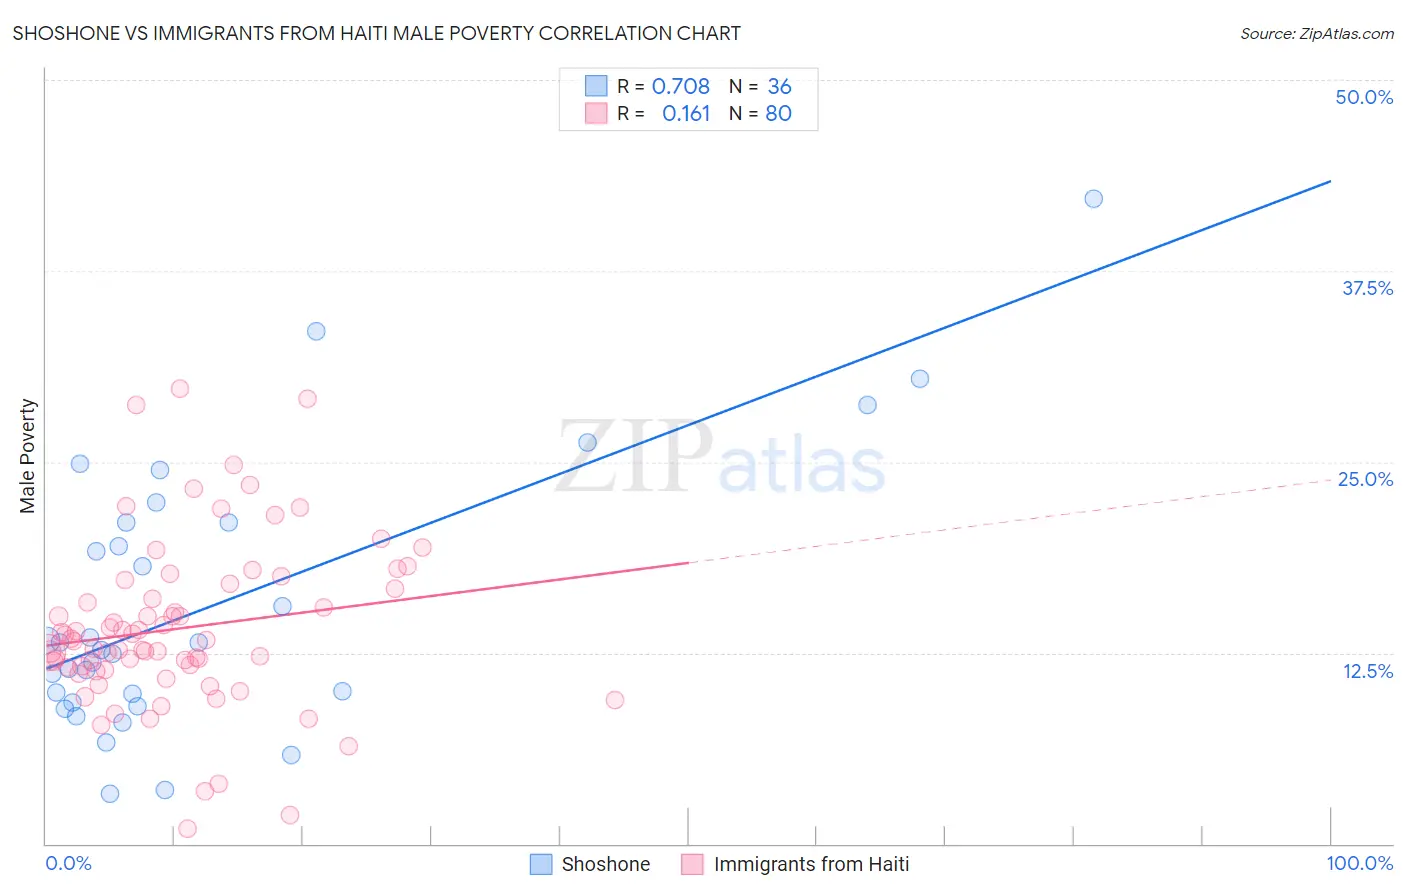
Shoshone vs Immigrants from Haiti Male Poverty Correlation Chart
The statistical analysis conducted on geographies consisting of 66,615,440 people shows a strong positive correlation between the proportion of Shoshone and poverty level among males in the United States with a correlation coefficient (R) of 0.708 and weighted average of 13.8%. Similarly, the statistical analysis conducted on geographies consisting of 225,134,025 people shows a poor positive correlation between the proportion of Immigrants from Haiti and poverty level among males in the United States with a correlation coefficient (R) of 0.161 and weighted average of 13.8%, a difference of 0.040%.
Male Poverty Correlation Summary
| Measurement | Shoshone | Immigrants from Haiti |
| Minimum | 3.3% | 0.99% |
| Maximum | 42.2% | 29.8% |
| Range | 38.9% | 28.8% |
| Mean | 15.7% | 14.1% |
| Median | 12.9% | 13.3% |
| Interquartile 25% (IQ1) | 9.5% | 11.5% |
| Interquartile 75% (IQ3) | 21.1% | 16.9% |
| Interquartile Range (IQR) | 11.5% | 5.4% |
| Standard Deviation (Sample) | 8.9% | 5.5% |
| Standard Deviation (Population) | 8.8% | 5.5% |
Demographics Similar to Shoshone and Immigrants from Haiti by Male Poverty
In terms of male poverty, the demographic groups most similar to Shoshone are Immigrants from Barbados (13.8%, a difference of 0.020%), West Indian (13.8%, a difference of 0.030%), Comanche (13.8%, a difference of 0.050%), Immigrants from St. Vincent and the Grenadines (13.8%, a difference of 0.18%), and Immigrants from Cabo Verde (13.7%, a difference of 0.26%). Similarly, the demographic groups most similar to Immigrants from Haiti are Comanche (13.8%, a difference of 0.010%), West Indian (13.8%, a difference of 0.010%), Immigrants from Barbados (13.8%, a difference of 0.060%), Immigrants from Cabo Verde (13.7%, a difference of 0.21%), and Immigrants from St. Vincent and the Grenadines (13.8%, a difference of 0.23%).
| Demographics | Rating | Rank | Male Poverty |
| Barbadians | 0.0 /100 | #275 | Tragic 13.6% |
| Immigrants | Latin America | 0.0 /100 | #276 | Tragic 13.6% |
| Bangladeshis | 0.0 /100 | #277 | Tragic 13.6% |
| Belizeans | 0.0 /100 | #278 | Tragic 13.6% |
| Haitians | 0.0 /100 | #279 | Tragic 13.7% |
| Mexicans | 0.0 /100 | #280 | Tragic 13.7% |
| Yaqui | 0.0 /100 | #281 | Tragic 13.7% |
| Immigrants | Cabo Verde | 0.0 /100 | #282 | Tragic 13.7% |
| Comanche | 0.0 /100 | #283 | Tragic 13.8% |
| Immigrants | Haiti | 0.0 /100 | #284 | Tragic 13.8% |
| West Indians | 0.0 /100 | #285 | Tragic 13.8% |
| Shoshone | 0.0 /100 | #286 | Tragic 13.8% |
| Immigrants | Barbados | 0.0 /100 | #287 | Tragic 13.8% |
| Immigrants | St. Vincent and the Grenadines | 0.0 /100 | #288 | Tragic 13.8% |
| Guatemalans | 0.0 /100 | #289 | Tragic 13.8% |
| Immigrants | Zaire | 0.0 /100 | #290 | Tragic 13.8% |
| Vietnamese | 0.0 /100 | #291 | Tragic 13.8% |
| Indonesians | 0.0 /100 | #292 | Tragic 13.8% |
| Immigrants | Belize | 0.0 /100 | #293 | Tragic 13.8% |
| Hispanics or Latinos | 0.0 /100 | #294 | Tragic 13.9% |
| Immigrants | Central America | 0.0 /100 | #295 | Tragic 13.9% |