Shoshone vs Immigrants from Bulgaria Male Poverty
COMPARE
Shoshone
Immigrants from Bulgaria
Male Poverty
Male Poverty Comparison
Shoshone
Immigrants from Bulgaria
13.8%
MALE POVERTY
0.0/ 100
METRIC RATING
286th/ 347
METRIC RANK
10.1%
MALE POVERTY
98.2/ 100
METRIC RATING
56th/ 347
METRIC RANK
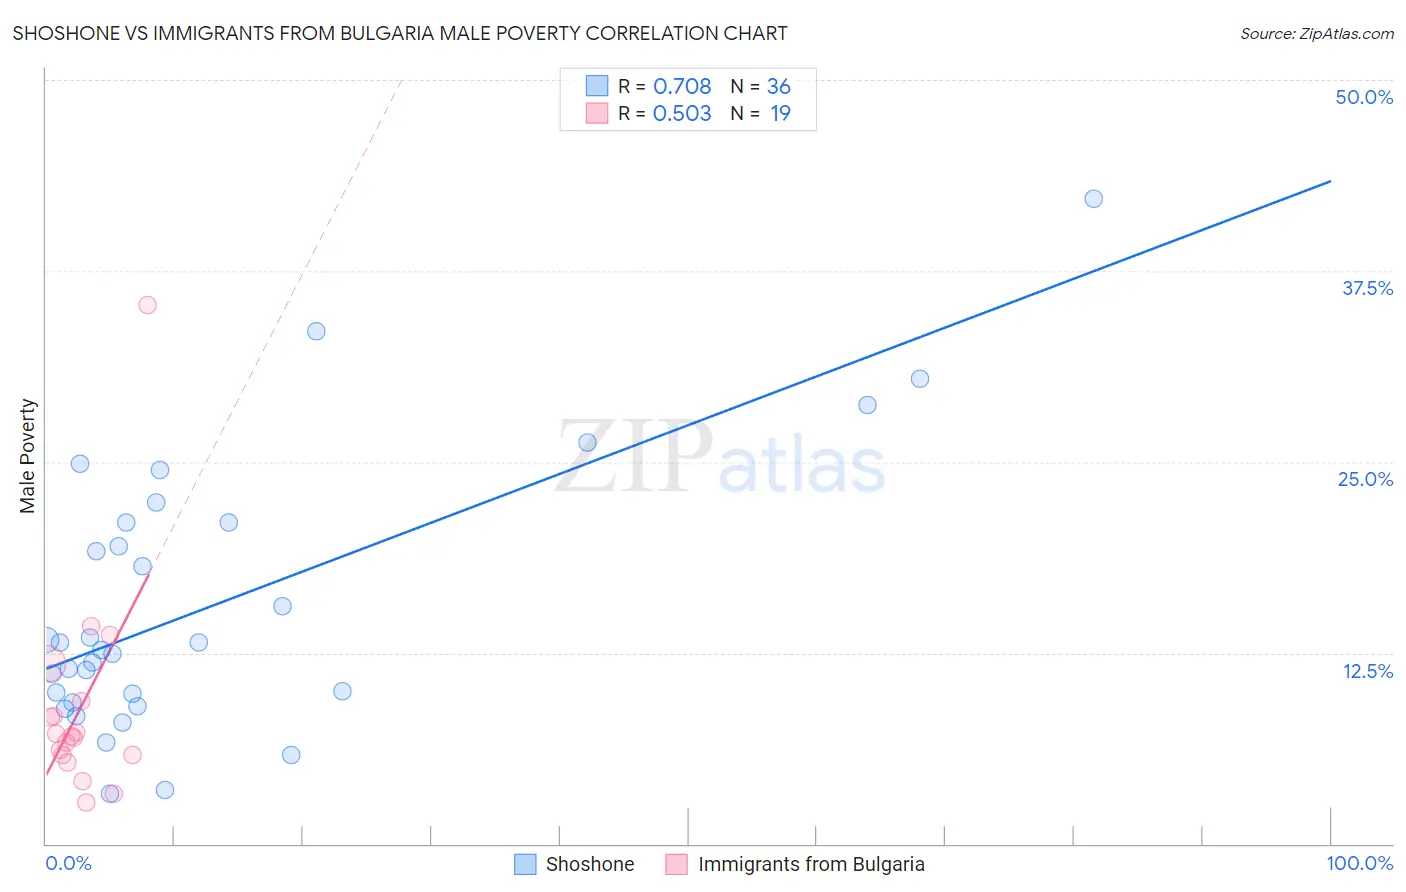
Shoshone vs Immigrants from Bulgaria Male Poverty Correlation Chart
The statistical analysis conducted on geographies consisting of 66,615,440 people shows a strong positive correlation between the proportion of Shoshone and poverty level among males in the United States with a correlation coefficient (R) of 0.708 and weighted average of 13.8%. Similarly, the statistical analysis conducted on geographies consisting of 172,528,634 people shows a substantial positive correlation between the proportion of Immigrants from Bulgaria and poverty level among males in the United States with a correlation coefficient (R) of 0.503 and weighted average of 10.1%, a difference of 36.3%.
Male Poverty Correlation Summary
| Measurement | Shoshone | Immigrants from Bulgaria |
| Minimum | 3.3% | 2.7% |
| Maximum | 42.2% | 35.3% |
| Range | 38.9% | 32.6% |
| Mean | 15.7% | 8.9% |
| Median | 12.9% | 7.0% |
| Interquartile 25% (IQ1) | 9.5% | 5.8% |
| Interquartile 75% (IQ3) | 21.1% | 9.4% |
| Interquartile Range (IQR) | 11.5% | 3.5% |
| Standard Deviation (Sample) | 8.9% | 7.1% |
| Standard Deviation (Population) | 8.8% | 6.9% |
Similar Demographics by Male Poverty
Demographics Similar to Shoshone by Male Poverty
In terms of male poverty, the demographic groups most similar to Shoshone are Immigrants from Barbados (13.8%, a difference of 0.020%), West Indian (13.8%, a difference of 0.030%), Immigrants from Haiti (13.8%, a difference of 0.040%), Comanche (13.8%, a difference of 0.050%), and Immigrants from St. Vincent and the Grenadines (13.8%, a difference of 0.18%).
| Demographics | Rating | Rank | Male Poverty |
| Haitians | 0.0 /100 | #279 | Tragic 13.7% |
| Mexicans | 0.0 /100 | #280 | Tragic 13.7% |
| Yaqui | 0.0 /100 | #281 | Tragic 13.7% |
| Immigrants | Cabo Verde | 0.0 /100 | #282 | Tragic 13.7% |
| Comanche | 0.0 /100 | #283 | Tragic 13.8% |
| Immigrants | Haiti | 0.0 /100 | #284 | Tragic 13.8% |
| West Indians | 0.0 /100 | #285 | Tragic 13.8% |
| Shoshone | 0.0 /100 | #286 | Tragic 13.8% |
| Immigrants | Barbados | 0.0 /100 | #287 | Tragic 13.8% |
| Immigrants | St. Vincent and the Grenadines | 0.0 /100 | #288 | Tragic 13.8% |
| Guatemalans | 0.0 /100 | #289 | Tragic 13.8% |
| Immigrants | Zaire | 0.0 /100 | #290 | Tragic 13.8% |
| Vietnamese | 0.0 /100 | #291 | Tragic 13.8% |
| Indonesians | 0.0 /100 | #292 | Tragic 13.8% |
| Immigrants | Belize | 0.0 /100 | #293 | Tragic 13.8% |
Demographics Similar to Immigrants from Bulgaria by Male Poverty
In terms of male poverty, the demographic groups most similar to Immigrants from Bulgaria are Estonian (10.1%, a difference of 0.14%), German (10.1%, a difference of 0.21%), Scandinavian (10.1%, a difference of 0.22%), Immigrants from Europe (10.1%, a difference of 0.35%), and Ukrainian (10.1%, a difference of 0.44%).
| Demographics | Rating | Rank | Male Poverty |
| Slovenes | 98.8 /100 | #49 | Exceptional 10.0% |
| Immigrants | Philippines | 98.7 /100 | #50 | Exceptional 10.0% |
| Immigrants | Croatia | 98.7 /100 | #51 | Exceptional 10.0% |
| Asians | 98.7 /100 | #52 | Exceptional 10.0% |
| Immigrants | Czechoslovakia | 98.6 /100 | #53 | Exceptional 10.0% |
| Immigrants | Austria | 98.5 /100 | #54 | Exceptional 10.0% |
| Germans | 98.3 /100 | #55 | Exceptional 10.1% |
| Immigrants | Bulgaria | 98.2 /100 | #56 | Exceptional 10.1% |
| Estonians | 98.1 /100 | #57 | Exceptional 10.1% |
| Scandinavians | 98.0 /100 | #58 | Exceptional 10.1% |
| Immigrants | Europe | 97.9 /100 | #59 | Exceptional 10.1% |
| Ukrainians | 97.9 /100 | #60 | Exceptional 10.1% |
| Austrians | 97.8 /100 | #61 | Exceptional 10.1% |
| Immigrants | Italy | 97.8 /100 | #62 | Exceptional 10.2% |
| Slovaks | 97.7 /100 | #63 | Exceptional 10.2% |