Serbian vs Ute Single Mother Poverty
COMPARE
Serbian
Ute
Single Mother Poverty
Single Mother Poverty Comparison
Serbians
Ute
28.6%
SINGLE MOTHER POVERTY
85.0/ 100
METRIC RATING
149th/ 347
METRIC RANK
35.7%
SINGLE MOTHER POVERTY
0.0/ 100
METRIC RATING
325th/ 347
METRIC RANK
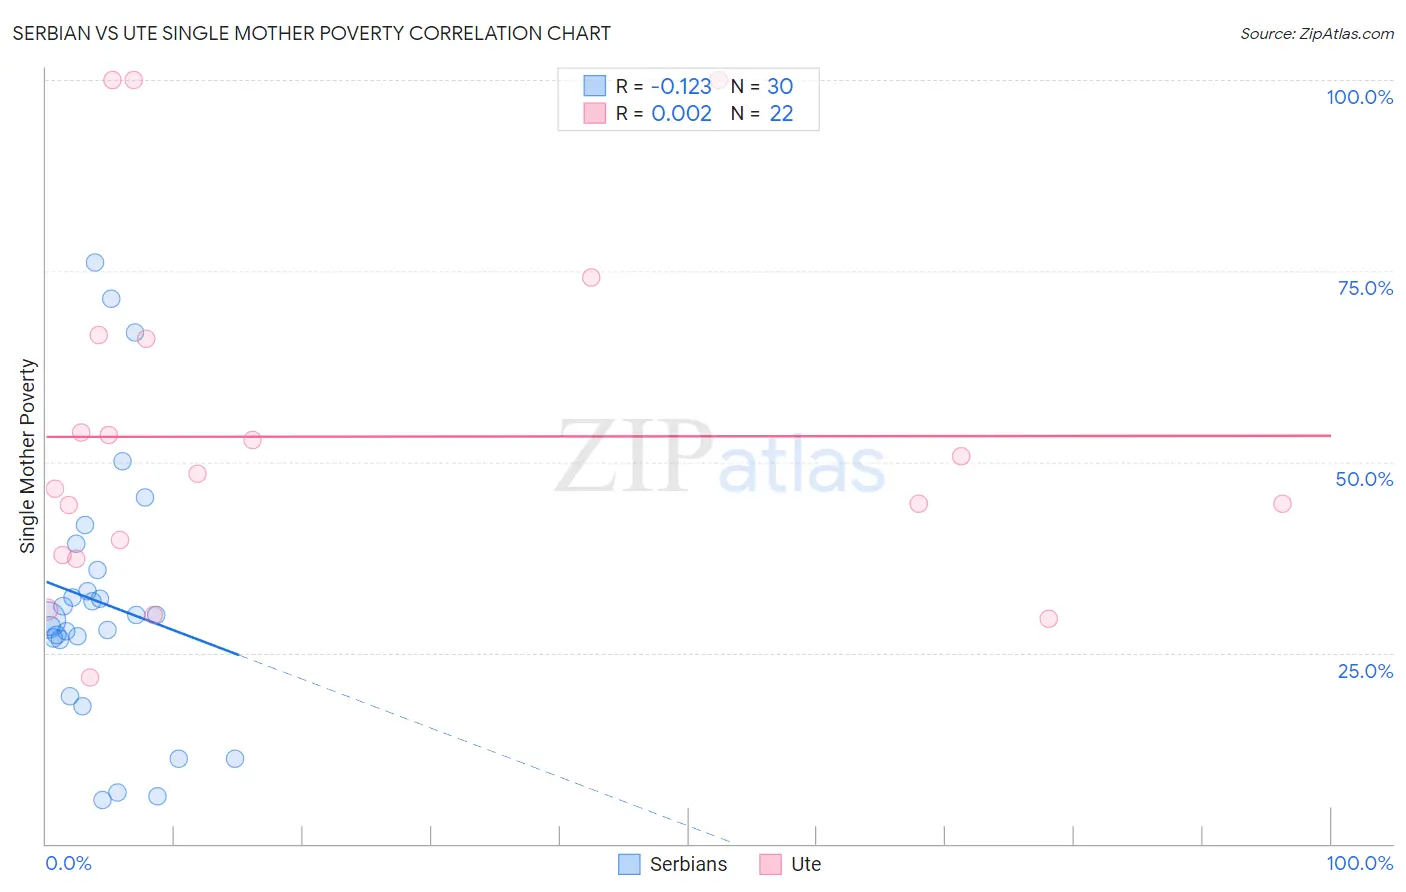
Serbian vs Ute Single Mother Poverty Correlation Chart
The statistical analysis conducted on geographies consisting of 262,198,183 people shows a poor negative correlation between the proportion of Serbians and poverty level among single mothers in the United States with a correlation coefficient (R) of -0.123 and weighted average of 28.6%. Similarly, the statistical analysis conducted on geographies consisting of 55,474,720 people shows no correlation between the proportion of Ute and poverty level among single mothers in the United States with a correlation coefficient (R) of 0.002 and weighted average of 35.7%, a difference of 25.0%.
Single Mother Poverty Correlation Summary
| Measurement | Serbian | Ute |
| Minimum | 5.8% | 21.7% |
| Maximum | 76.1% | 100.0% |
| Range | 70.4% | 78.3% |
| Mean | 31.6% | 53.3% |
| Median | 29.6% | 47.4% |
| Interquartile 25% (IQ1) | 26.8% | 37.9% |
| Interquartile 75% (IQ3) | 35.8% | 66.2% |
| Interquartile Range (IQR) | 9.0% | 28.3% |
| Standard Deviation (Sample) | 17.4% | 22.8% |
| Standard Deviation (Population) | 17.1% | 22.3% |
Similar Demographics by Single Mother Poverty
Demographics Similar to Serbians by Single Mother Poverty
In terms of single mother poverty, the demographic groups most similar to Serbians are Syrian (28.6%, a difference of 0.020%), Immigrants from Lebanon (28.6%, a difference of 0.030%), Immigrants from Denmark (28.5%, a difference of 0.10%), Immigrants from South America (28.5%, a difference of 0.11%), and Luxembourger (28.5%, a difference of 0.14%).
| Demographics | Rating | Rank | Single Mother Poverty |
| South Africans | 86.6 /100 | #142 | Excellent 28.5% |
| Immigrants | North America | 86.5 /100 | #143 | Excellent 28.5% |
| Luxembourgers | 86.4 /100 | #144 | Excellent 28.5% |
| Immigrants | South America | 86.1 /100 | #145 | Excellent 28.5% |
| Immigrants | Denmark | 86.1 /100 | #146 | Excellent 28.5% |
| Immigrants | Lebanon | 85.3 /100 | #147 | Excellent 28.6% |
| Syrians | 85.3 /100 | #148 | Excellent 28.6% |
| Serbians | 85.0 /100 | #149 | Excellent 28.6% |
| Northern Europeans | 81.7 /100 | #150 | Excellent 28.6% |
| Immigrants | Oceania | 79.9 /100 | #151 | Good 28.7% |
| Austrians | 79.0 /100 | #152 | Good 28.7% |
| Slovenes | 76.4 /100 | #153 | Good 28.8% |
| Portuguese | 73.2 /100 | #154 | Good 28.8% |
| Ugandans | 71.7 /100 | #155 | Good 28.8% |
| Iraqis | 71.5 /100 | #156 | Good 28.8% |
Demographics Similar to Ute by Single Mother Poverty
In terms of single mother poverty, the demographic groups most similar to Ute are Seminole (35.8%, a difference of 0.30%), Ottawa (35.5%, a difference of 0.48%), Kiowa (35.5%, a difference of 0.69%), Black/African American (35.2%, a difference of 1.4%), and Paiute (35.1%, a difference of 1.6%).
| Demographics | Rating | Rank | Single Mother Poverty |
| Immigrants | Honduras | 0.0 /100 | #318 | Tragic 34.7% |
| Chippewa | 0.0 /100 | #319 | Tragic 34.8% |
| Iroquois | 0.0 /100 | #320 | Tragic 34.8% |
| Paiute | 0.0 /100 | #321 | Tragic 35.1% |
| Blacks/African Americans | 0.0 /100 | #322 | Tragic 35.2% |
| Kiowa | 0.0 /100 | #323 | Tragic 35.5% |
| Ottawa | 0.0 /100 | #324 | Tragic 35.5% |
| Ute | 0.0 /100 | #325 | Tragic 35.7% |
| Seminole | 0.0 /100 | #326 | Tragic 35.8% |
| Yakama | 0.0 /100 | #327 | Tragic 36.4% |
| Choctaw | 0.0 /100 | #328 | Tragic 36.4% |
| Apache | 0.0 /100 | #329 | Tragic 36.6% |
| Natives/Alaskans | 0.0 /100 | #330 | Tragic 36.6% |
| Creek | 0.0 /100 | #331 | Tragic 36.7% |
| Dutch West Indians | 0.0 /100 | #332 | Tragic 36.8% |