Serbian vs Immigrants from Northern Europe Single Mother Poverty
COMPARE
Serbian
Immigrants from Northern Europe
Single Mother Poverty
Single Mother Poverty Comparison
Serbians
Immigrants from Northern Europe
28.6%
SINGLE MOTHER POVERTY
85.0/ 100
METRIC RATING
149th/ 347
METRIC RANK
27.3%
SINGLE MOTHER POVERTY
99.5/ 100
METRIC RATING
63rd/ 347
METRIC RANK
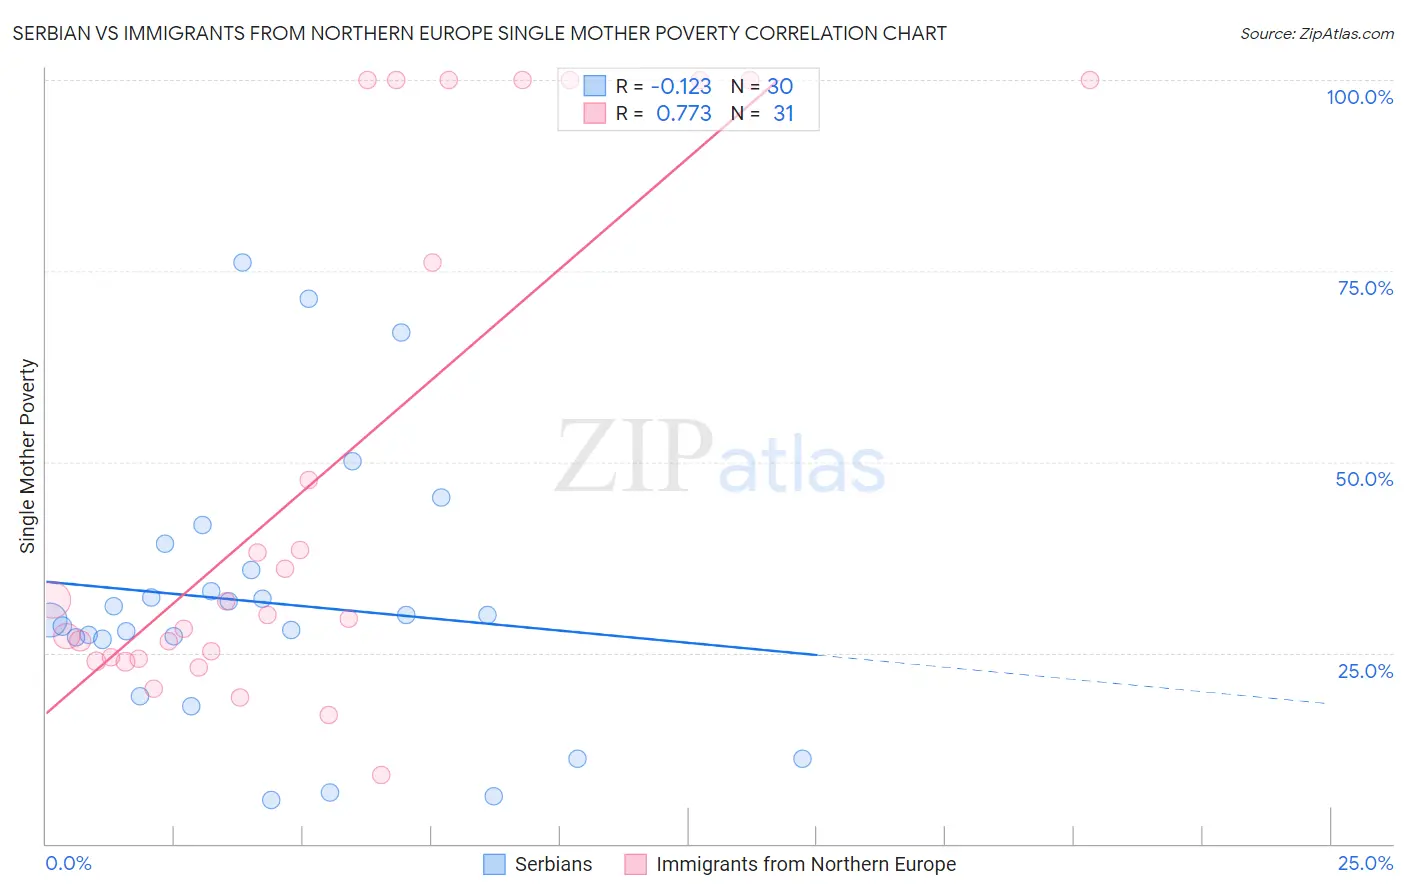
Serbian vs Immigrants from Northern Europe Single Mother Poverty Correlation Chart
The statistical analysis conducted on geographies consisting of 262,198,183 people shows a poor negative correlation between the proportion of Serbians and poverty level among single mothers in the United States with a correlation coefficient (R) of -0.123 and weighted average of 28.6%. Similarly, the statistical analysis conducted on geographies consisting of 459,610,123 people shows a strong positive correlation between the proportion of Immigrants from Northern Europe and poverty level among single mothers in the United States with a correlation coefficient (R) of 0.773 and weighted average of 27.3%, a difference of 4.6%.
Single Mother Poverty Correlation Summary
| Measurement | Serbian | Immigrants from Northern Europe |
| Minimum | 5.8% | 9.1% |
| Maximum | 76.1% | 100.0% |
| Range | 70.4% | 90.9% |
| Mean | 31.6% | 47.7% |
| Median | 29.6% | 29.9% |
| Interquartile 25% (IQ1) | 26.8% | 24.2% |
| Interquartile 75% (IQ3) | 35.8% | 100.0% |
| Interquartile Range (IQR) | 9.0% | 75.8% |
| Standard Deviation (Sample) | 17.4% | 33.3% |
| Standard Deviation (Population) | 17.1% | 32.7% |
Similar Demographics by Single Mother Poverty
Demographics Similar to Serbians by Single Mother Poverty
In terms of single mother poverty, the demographic groups most similar to Serbians are Syrian (28.6%, a difference of 0.020%), Immigrants from Lebanon (28.6%, a difference of 0.030%), Immigrants from Denmark (28.5%, a difference of 0.10%), Immigrants from South America (28.5%, a difference of 0.11%), and Luxembourger (28.5%, a difference of 0.14%).
| Demographics | Rating | Rank | Single Mother Poverty |
| South Africans | 86.6 /100 | #142 | Excellent 28.5% |
| Immigrants | North America | 86.5 /100 | #143 | Excellent 28.5% |
| Luxembourgers | 86.4 /100 | #144 | Excellent 28.5% |
| Immigrants | South America | 86.1 /100 | #145 | Excellent 28.5% |
| Immigrants | Denmark | 86.1 /100 | #146 | Excellent 28.5% |
| Immigrants | Lebanon | 85.3 /100 | #147 | Excellent 28.6% |
| Syrians | 85.3 /100 | #148 | Excellent 28.6% |
| Serbians | 85.0 /100 | #149 | Excellent 28.6% |
| Northern Europeans | 81.7 /100 | #150 | Excellent 28.6% |
| Immigrants | Oceania | 79.9 /100 | #151 | Good 28.7% |
| Austrians | 79.0 /100 | #152 | Good 28.7% |
| Slovenes | 76.4 /100 | #153 | Good 28.8% |
| Portuguese | 73.2 /100 | #154 | Good 28.8% |
| Ugandans | 71.7 /100 | #155 | Good 28.8% |
| Iraqis | 71.5 /100 | #156 | Good 28.8% |
Demographics Similar to Immigrants from Northern Europe by Single Mother Poverty
In terms of single mother poverty, the demographic groups most similar to Immigrants from Northern Europe are Russian (27.3%, a difference of 0.030%), Immigrants from Malaysia (27.3%, a difference of 0.050%), Immigrants from Turkey (27.3%, a difference of 0.11%), Soviet Union (27.3%, a difference of 0.15%), and Immigrants from Australia (27.3%, a difference of 0.17%).
| Demographics | Rating | Rank | Single Mother Poverty |
| Immigrants | Romania | 99.7 /100 | #56 | Exceptional 27.2% |
| Palestinians | 99.7 /100 | #57 | Exceptional 27.2% |
| Argentineans | 99.6 /100 | #58 | Exceptional 27.2% |
| Paraguayans | 99.6 /100 | #59 | Exceptional 27.2% |
| Eastern Europeans | 99.6 /100 | #60 | Exceptional 27.2% |
| Immigrants | Eastern Europe | 99.6 /100 | #61 | Exceptional 27.2% |
| Immigrants | Malaysia | 99.5 /100 | #62 | Exceptional 27.3% |
| Immigrants | Northern Europe | 99.5 /100 | #63 | Exceptional 27.3% |
| Russians | 99.5 /100 | #64 | Exceptional 27.3% |
| Immigrants | Turkey | 99.5 /100 | #65 | Exceptional 27.3% |
| Soviet Union | 99.5 /100 | #66 | Exceptional 27.3% |
| Immigrants | Australia | 99.5 /100 | #67 | Exceptional 27.3% |
| Immigrants | Czechoslovakia | 99.5 /100 | #68 | Exceptional 27.4% |
| Lithuanians | 99.4 /100 | #69 | Exceptional 27.4% |
| Immigrants | Belarus | 99.4 /100 | #70 | Exceptional 27.4% |