Cuban vs Immigrants from Northern Europe Single Mother Poverty
COMPARE
Cuban
Immigrants from Northern Europe
Single Mother Poverty
Single Mother Poverty Comparison
Cubans
Immigrants from Northern Europe
29.6%
SINGLE MOTHER POVERTY
20.8/ 100
METRIC RATING
199th/ 347
METRIC RANK
27.3%
SINGLE MOTHER POVERTY
99.5/ 100
METRIC RATING
63rd/ 347
METRIC RANK
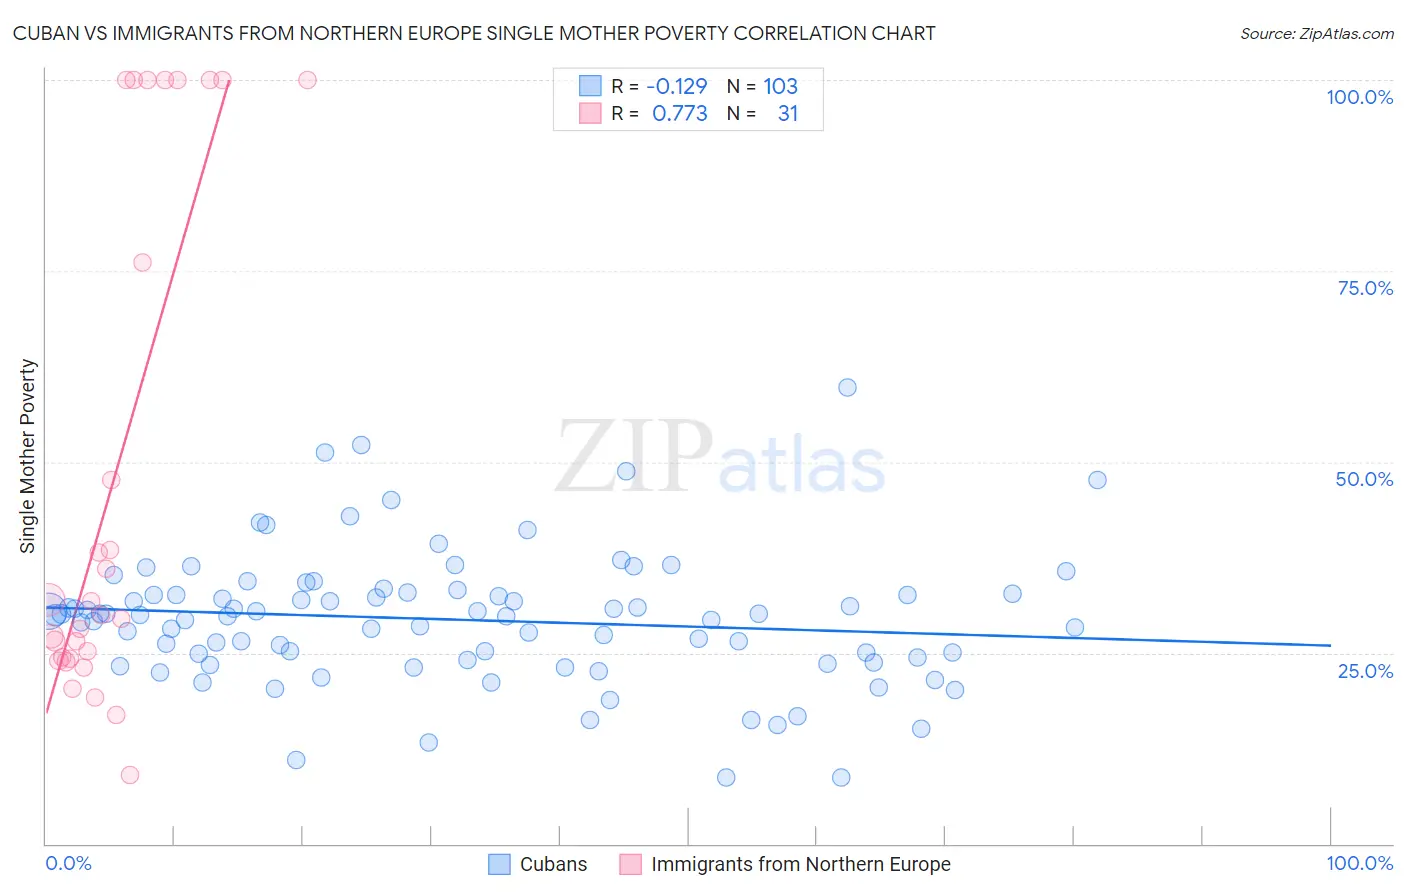
Cuban vs Immigrants from Northern Europe Single Mother Poverty Correlation Chart
The statistical analysis conducted on geographies consisting of 437,360,929 people shows a poor negative correlation between the proportion of Cubans and poverty level among single mothers in the United States with a correlation coefficient (R) of -0.129 and weighted average of 29.6%. Similarly, the statistical analysis conducted on geographies consisting of 459,610,123 people shows a strong positive correlation between the proportion of Immigrants from Northern Europe and poverty level among single mothers in the United States with a correlation coefficient (R) of 0.773 and weighted average of 27.3%, a difference of 8.6%.
Single Mother Poverty Correlation Summary
| Measurement | Cuban | Immigrants from Northern Europe |
| Minimum | 8.7% | 9.1% |
| Maximum | 59.8% | 100.0% |
| Range | 51.1% | 90.9% |
| Mean | 29.3% | 47.7% |
| Median | 29.9% | 29.9% |
| Interquartile 25% (IQ1) | 24.0% | 24.2% |
| Interquartile 75% (IQ3) | 32.7% | 100.0% |
| Interquartile Range (IQR) | 8.7% | 75.8% |
| Standard Deviation (Sample) | 8.7% | 33.3% |
| Standard Deviation (Population) | 8.7% | 32.7% |
Similar Demographics by Single Mother Poverty
Demographics Similar to Cubans by Single Mother Poverty
In terms of single mother poverty, the demographic groups most similar to Cubans are Panamanian (29.6%, a difference of 0.050%), Trinidadian and Tobagonian (29.6%, a difference of 0.070%), Immigrants from Jamaica (29.6%, a difference of 0.080%), Belgian (29.7%, a difference of 0.15%), and Spanish American Indian (29.6%, a difference of 0.18%).
| Demographics | Rating | Rank | Single Mother Poverty |
| Moroccans | 28.6 /100 | #192 | Fair 29.5% |
| Basques | 28.3 /100 | #193 | Fair 29.5% |
| Icelanders | 26.1 /100 | #194 | Fair 29.5% |
| Slavs | 24.5 /100 | #195 | Fair 29.6% |
| Spanish American Indians | 23.4 /100 | #196 | Fair 29.6% |
| Immigrants | Jamaica | 22.0 /100 | #197 | Fair 29.6% |
| Trinidadians and Tobagonians | 21.7 /100 | #198 | Fair 29.6% |
| Cubans | 20.8 /100 | #199 | Fair 29.6% |
| Panamanians | 20.0 /100 | #200 | Fair 29.6% |
| Belgians | 18.8 /100 | #201 | Poor 29.7% |
| Malaysians | 17.4 /100 | #202 | Poor 29.7% |
| Swiss | 17.2 /100 | #203 | Poor 29.7% |
| Immigrants | Immigrants | 16.6 /100 | #204 | Poor 29.7% |
| Czechoslovakians | 16.1 /100 | #205 | Poor 29.7% |
| Immigrants | Haiti | 15.8 /100 | #206 | Poor 29.7% |
Demographics Similar to Immigrants from Northern Europe by Single Mother Poverty
In terms of single mother poverty, the demographic groups most similar to Immigrants from Northern Europe are Russian (27.3%, a difference of 0.030%), Immigrants from Malaysia (27.3%, a difference of 0.050%), Immigrants from Turkey (27.3%, a difference of 0.11%), Soviet Union (27.3%, a difference of 0.15%), and Immigrants from Australia (27.3%, a difference of 0.17%).
| Demographics | Rating | Rank | Single Mother Poverty |
| Immigrants | Romania | 99.7 /100 | #56 | Exceptional 27.2% |
| Palestinians | 99.7 /100 | #57 | Exceptional 27.2% |
| Argentineans | 99.6 /100 | #58 | Exceptional 27.2% |
| Paraguayans | 99.6 /100 | #59 | Exceptional 27.2% |
| Eastern Europeans | 99.6 /100 | #60 | Exceptional 27.2% |
| Immigrants | Eastern Europe | 99.6 /100 | #61 | Exceptional 27.2% |
| Immigrants | Malaysia | 99.5 /100 | #62 | Exceptional 27.3% |
| Immigrants | Northern Europe | 99.5 /100 | #63 | Exceptional 27.3% |
| Russians | 99.5 /100 | #64 | Exceptional 27.3% |
| Immigrants | Turkey | 99.5 /100 | #65 | Exceptional 27.3% |
| Soviet Union | 99.5 /100 | #66 | Exceptional 27.3% |
| Immigrants | Australia | 99.5 /100 | #67 | Exceptional 27.3% |
| Immigrants | Czechoslovakia | 99.5 /100 | #68 | Exceptional 27.4% |
| Lithuanians | 99.4 /100 | #69 | Exceptional 27.4% |
| Immigrants | Belarus | 99.4 /100 | #70 | Exceptional 27.4% |