Scotch-Irish vs Crow Female Poverty Among 25-34 Year Olds
COMPARE
Scotch-Irish
Crow
Female Poverty Among 25-34 Year Olds
Female Poverty Among 25-34 Year Olds Comparison
Scotch-Irish
Crow
14.8%
FEMALE POVERTY AMONG 25-34 YEAR OLDS
1.2/ 100
METRIC RATING
241st/ 347
METRIC RANK
22.7%
FEMALE POVERTY AMONG 25-34 YEAR OLDS
0.0/ 100
METRIC RATING
337th/ 347
METRIC RANK
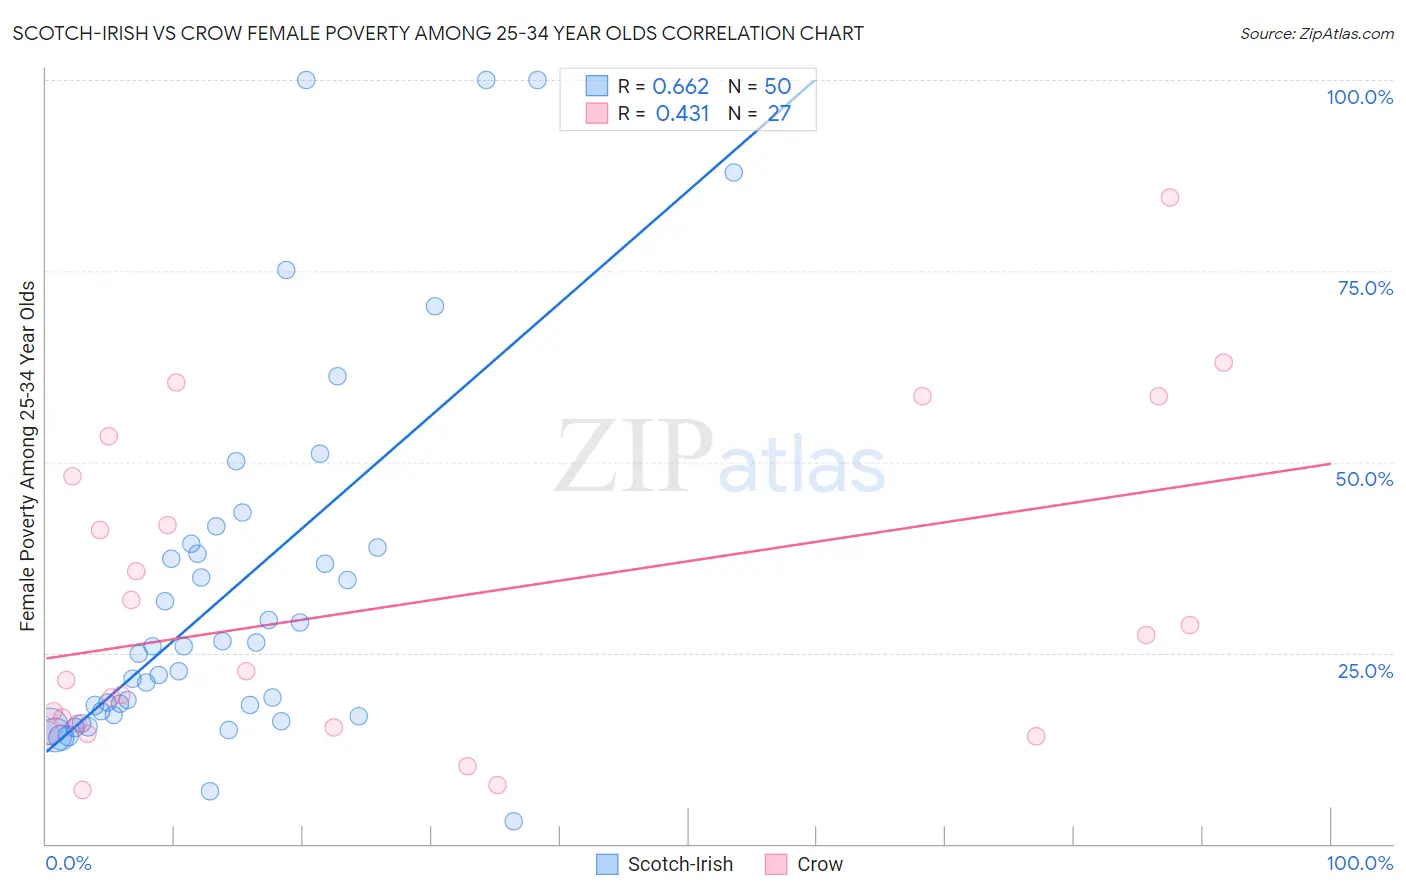
Scotch-Irish vs Crow Female Poverty Among 25-34 Year Olds Correlation Chart
The statistical analysis conducted on geographies consisting of 529,538,940 people shows a significant positive correlation between the proportion of Scotch-Irish and poverty level among females between the ages 25 and 34 in the United States with a correlation coefficient (R) of 0.662 and weighted average of 14.8%. Similarly, the statistical analysis conducted on geographies consisting of 59,005,346 people shows a moderate positive correlation between the proportion of Crow and poverty level among females between the ages 25 and 34 in the United States with a correlation coefficient (R) of 0.431 and weighted average of 22.7%, a difference of 53.4%.
Female Poverty Among 25-34 Year Olds Correlation Summary
| Measurement | Scotch-Irish | Crow |
| Minimum | 2.9% | 7.1% |
| Maximum | 100.0% | 84.6% |
| Range | 97.1% | 77.6% |
| Mean | 33.1% | 31.4% |
| Median | 25.3% | 22.7% |
| Interquartile 25% (IQ1) | 16.8% | 15.2% |
| Interquartile 75% (IQ3) | 38.8% | 48.1% |
| Interquartile Range (IQR) | 22.0% | 32.9% |
| Standard Deviation (Sample) | 24.2% | 20.6% |
| Standard Deviation (Population) | 24.0% | 20.2% |
Similar Demographics by Female Poverty Among 25-34 Year Olds
Demographics Similar to Scotch-Irish by Female Poverty Among 25-34 Year Olds
In terms of female poverty among 25-34 year olds, the demographic groups most similar to Scotch-Irish are Barbadian (14.8%, a difference of 0.0%), Immigrants from Nicaragua (14.8%, a difference of 0.040%), Immigrants from Bangladesh (14.8%, a difference of 0.040%), Immigrants from Middle Africa (14.8%, a difference of 0.22%), and Immigrants from Grenada (14.7%, a difference of 0.26%).
| Demographics | Rating | Rank | Female Poverty Among 25-34 Year Olds |
| Cubans | 1.6 /100 | #234 | Tragic 14.7% |
| Immigrants | Jamaica | 1.4 /100 | #235 | Tragic 14.7% |
| Salvadorans | 1.4 /100 | #236 | Tragic 14.7% |
| Immigrants | Ghana | 1.4 /100 | #237 | Tragic 14.7% |
| Alsatians | 1.4 /100 | #238 | Tragic 14.7% |
| Malaysians | 1.4 /100 | #239 | Tragic 14.7% |
| Immigrants | Grenada | 1.3 /100 | #240 | Tragic 14.7% |
| Scotch-Irish | 1.2 /100 | #241 | Tragic 14.8% |
| Barbadians | 1.2 /100 | #242 | Tragic 14.8% |
| Immigrants | Nicaragua | 1.1 /100 | #243 | Tragic 14.8% |
| Immigrants | Bangladesh | 1.1 /100 | #244 | Tragic 14.8% |
| Immigrants | Middle Africa | 1.0 /100 | #245 | Tragic 14.8% |
| Jamaicans | 1.0 /100 | #246 | Tragic 14.8% |
| German Russians | 0.8 /100 | #247 | Tragic 14.9% |
| Immigrants | Western Africa | 0.8 /100 | #248 | Tragic 14.9% |
Demographics Similar to Crow by Female Poverty Among 25-34 Year Olds
In terms of female poverty among 25-34 year olds, the demographic groups most similar to Crow are Houma (22.7%, a difference of 0.17%), Yuman (22.9%, a difference of 1.0%), Sioux (23.0%, a difference of 1.2%), Pueblo (22.2%, a difference of 2.3%), and Navajo (23.3%, a difference of 2.9%).
| Demographics | Rating | Rank | Female Poverty Among 25-34 Year Olds |
| Paiute | 0.0 /100 | #330 | Tragic 19.6% |
| Kiowa | 0.0 /100 | #331 | Tragic 19.7% |
| Immigrants | Yemen | 0.0 /100 | #332 | Tragic 19.8% |
| Cajuns | 0.0 /100 | #333 | Tragic 19.9% |
| Apache | 0.0 /100 | #334 | Tragic 20.1% |
| Natives/Alaskans | 0.0 /100 | #335 | Tragic 20.3% |
| Pueblo | 0.0 /100 | #336 | Tragic 22.2% |
| Crow | 0.0 /100 | #337 | Tragic 22.7% |
| Houma | 0.0 /100 | #338 | Tragic 22.7% |
| Yuman | 0.0 /100 | #339 | Tragic 22.9% |
| Sioux | 0.0 /100 | #340 | Tragic 23.0% |
| Navajo | 0.0 /100 | #341 | Tragic 23.3% |
| Hopi | 0.0 /100 | #342 | Tragic 23.7% |
| Yup'ik | 0.0 /100 | #343 | Tragic 24.3% |
| Tohono O'odham | 0.0 /100 | #344 | Tragic 24.7% |