Alaska Native vs Crow Female Poverty Among 25-34 Year Olds
COMPARE
Alaska Native
Crow
Female Poverty Among 25-34 Year Olds
Female Poverty Among 25-34 Year Olds Comparison
Alaska Natives
Crow
16.8%
FEMALE POVERTY AMONG 25-34 YEAR OLDS
0.0/ 100
METRIC RATING
302nd/ 347
METRIC RANK
22.7%
FEMALE POVERTY AMONG 25-34 YEAR OLDS
0.0/ 100
METRIC RATING
337th/ 347
METRIC RANK
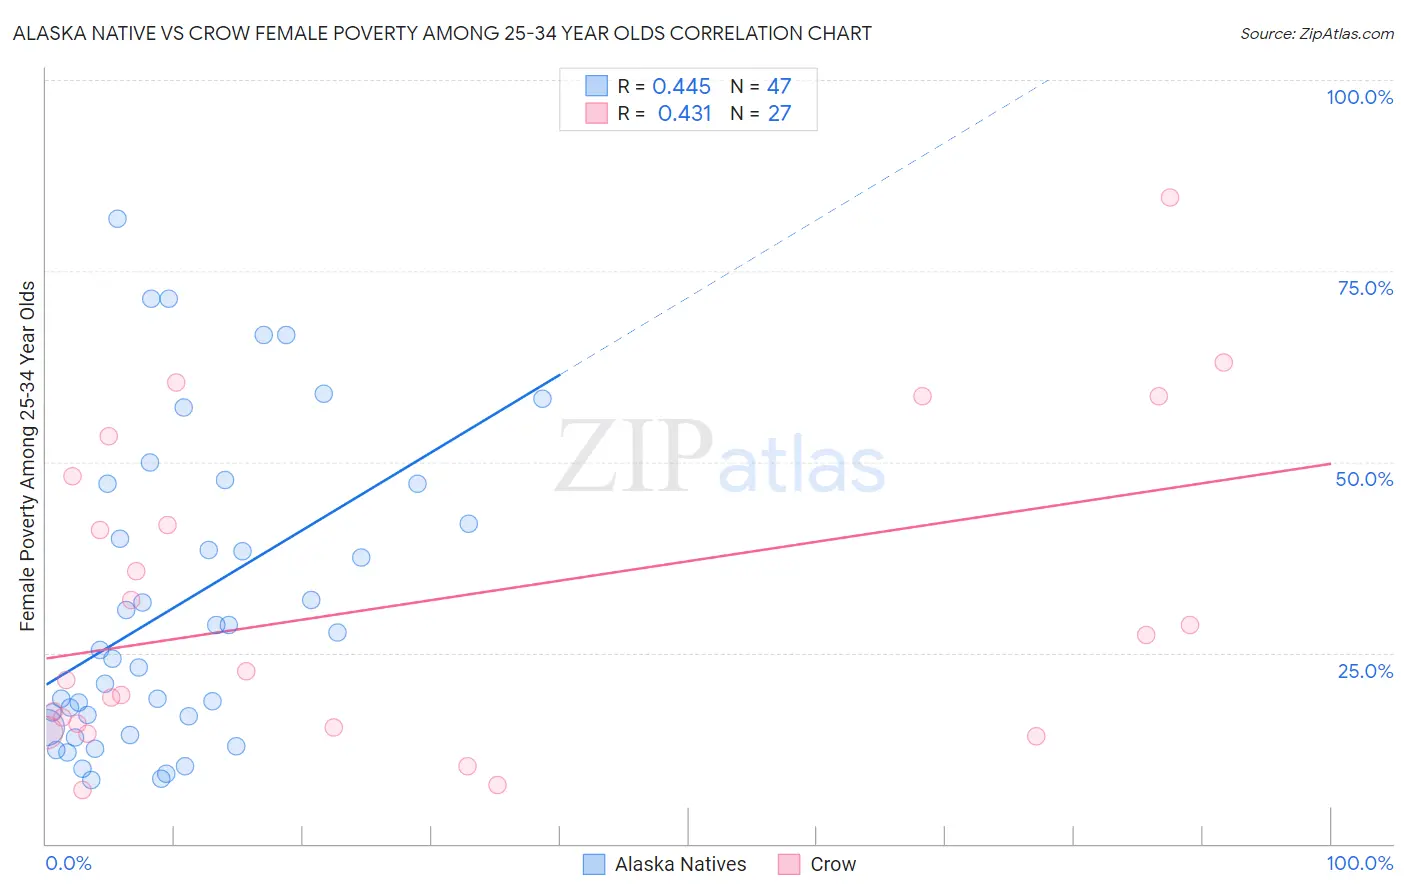
Alaska Native vs Crow Female Poverty Among 25-34 Year Olds Correlation Chart
The statistical analysis conducted on geographies consisting of 76,506,826 people shows a moderate positive correlation between the proportion of Alaska Natives and poverty level among females between the ages 25 and 34 in the United States with a correlation coefficient (R) of 0.445 and weighted average of 16.8%. Similarly, the statistical analysis conducted on geographies consisting of 59,005,346 people shows a moderate positive correlation between the proportion of Crow and poverty level among females between the ages 25 and 34 in the United States with a correlation coefficient (R) of 0.431 and weighted average of 22.7%, a difference of 35.3%.
Female Poverty Among 25-34 Year Olds Correlation Summary
| Measurement | Alaska Native | Crow |
| Minimum | 8.3% | 7.1% |
| Maximum | 81.8% | 84.6% |
| Range | 73.5% | 77.6% |
| Mean | 31.4% | 31.4% |
| Median | 25.4% | 22.7% |
| Interquartile 25% (IQ1) | 15.2% | 15.2% |
| Interquartile 75% (IQ3) | 47.1% | 48.1% |
| Interquartile Range (IQR) | 31.8% | 32.9% |
| Standard Deviation (Sample) | 20.0% | 20.6% |
| Standard Deviation (Population) | 19.8% | 20.2% |
Similar Demographics by Female Poverty Among 25-34 Year Olds
Demographics Similar to Alaska Natives by Female Poverty Among 25-34 Year Olds
In terms of female poverty among 25-34 year olds, the demographic groups most similar to Alaska Natives are Immigrants from Congo (16.7%, a difference of 0.11%), U.S. Virgin Islander (16.7%, a difference of 0.12%), Spanish American (16.7%, a difference of 0.27%), Blackfeet (16.7%, a difference of 0.31%), and Immigrants from Mexico (16.8%, a difference of 0.31%).
| Demographics | Rating | Rank | Female Poverty Among 25-34 Year Olds |
| Mexicans | 0.0 /100 | #295 | Tragic 16.6% |
| Hispanics or Latinos | 0.0 /100 | #296 | Tragic 16.6% |
| Immigrants | Guatemala | 0.0 /100 | #297 | Tragic 16.6% |
| Blackfeet | 0.0 /100 | #298 | Tragic 16.7% |
| Spanish Americans | 0.0 /100 | #299 | Tragic 16.7% |
| U.S. Virgin Islanders | 0.0 /100 | #300 | Tragic 16.7% |
| Immigrants | Congo | 0.0 /100 | #301 | Tragic 16.7% |
| Alaska Natives | 0.0 /100 | #302 | Tragic 16.8% |
| Immigrants | Mexico | 0.0 /100 | #303 | Tragic 16.8% |
| Hondurans | 0.0 /100 | #304 | Tragic 16.9% |
| Immigrants | Cabo Verde | 0.0 /100 | #305 | Tragic 16.9% |
| Chickasaw | 0.0 /100 | #306 | Tragic 17.0% |
| Yaqui | 0.0 /100 | #307 | Tragic 17.0% |
| Africans | 0.0 /100 | #308 | Tragic 17.0% |
| Ottawa | 0.0 /100 | #309 | Tragic 17.1% |
Demographics Similar to Crow by Female Poverty Among 25-34 Year Olds
In terms of female poverty among 25-34 year olds, the demographic groups most similar to Crow are Houma (22.7%, a difference of 0.17%), Yuman (22.9%, a difference of 1.0%), Sioux (23.0%, a difference of 1.2%), Pueblo (22.2%, a difference of 2.3%), and Navajo (23.3%, a difference of 2.9%).
| Demographics | Rating | Rank | Female Poverty Among 25-34 Year Olds |
| Paiute | 0.0 /100 | #330 | Tragic 19.6% |
| Kiowa | 0.0 /100 | #331 | Tragic 19.7% |
| Immigrants | Yemen | 0.0 /100 | #332 | Tragic 19.8% |
| Cajuns | 0.0 /100 | #333 | Tragic 19.9% |
| Apache | 0.0 /100 | #334 | Tragic 20.1% |
| Natives/Alaskans | 0.0 /100 | #335 | Tragic 20.3% |
| Pueblo | 0.0 /100 | #336 | Tragic 22.2% |
| Crow | 0.0 /100 | #337 | Tragic 22.7% |
| Houma | 0.0 /100 | #338 | Tragic 22.7% |
| Yuman | 0.0 /100 | #339 | Tragic 22.9% |
| Sioux | 0.0 /100 | #340 | Tragic 23.0% |
| Navajo | 0.0 /100 | #341 | Tragic 23.3% |
| Hopi | 0.0 /100 | #342 | Tragic 23.7% |
| Yup'ik | 0.0 /100 | #343 | Tragic 24.3% |
| Tohono O'odham | 0.0 /100 | #344 | Tragic 24.7% |