Scotch-Irish vs Immigrants from Liberia Female Poverty Among 25-34 Year Olds
COMPARE
Scotch-Irish
Immigrants from Liberia
Female Poverty Among 25-34 Year Olds
Female Poverty Among 25-34 Year Olds Comparison
Scotch-Irish
Immigrants from Liberia
14.8%
FEMALE POVERTY AMONG 25-34 YEAR OLDS
1.2/ 100
METRIC RATING
241st/ 347
METRIC RANK
15.4%
FEMALE POVERTY AMONG 25-34 YEAR OLDS
0.1/ 100
METRIC RATING
265th/ 347
METRIC RANK
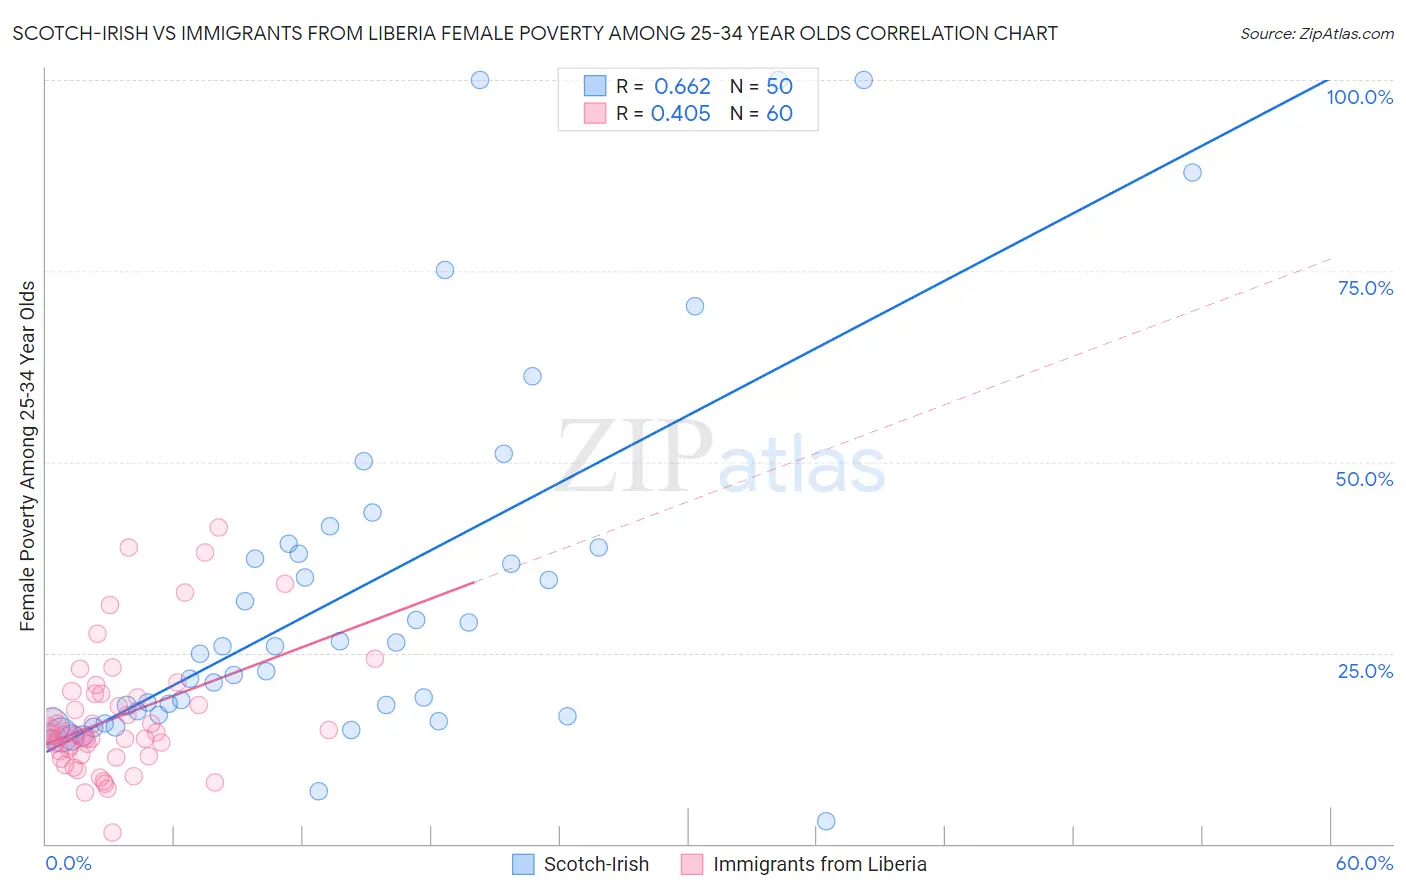
Scotch-Irish vs Immigrants from Liberia Female Poverty Among 25-34 Year Olds Correlation Chart
The statistical analysis conducted on geographies consisting of 529,538,940 people shows a significant positive correlation between the proportion of Scotch-Irish and poverty level among females between the ages 25 and 34 in the United States with a correlation coefficient (R) of 0.662 and weighted average of 14.8%. Similarly, the statistical analysis conducted on geographies consisting of 134,650,303 people shows a moderate positive correlation between the proportion of Immigrants from Liberia and poverty level among females between the ages 25 and 34 in the United States with a correlation coefficient (R) of 0.405 and weighted average of 15.4%, a difference of 4.4%.
Female Poverty Among 25-34 Year Olds Correlation Summary
| Measurement | Scotch-Irish | Immigrants from Liberia |
| Minimum | 2.9% | 1.5% |
| Maximum | 100.0% | 41.5% |
| Range | 97.1% | 40.0% |
| Mean | 33.1% | 16.5% |
| Median | 25.3% | 14.2% |
| Interquartile 25% (IQ1) | 16.8% | 11.8% |
| Interquartile 75% (IQ3) | 38.8% | 19.4% |
| Interquartile Range (IQR) | 22.0% | 7.5% |
| Standard Deviation (Sample) | 24.2% | 8.1% |
| Standard Deviation (Population) | 24.0% | 8.0% |
Similar Demographics by Female Poverty Among 25-34 Year Olds
Demographics Similar to Scotch-Irish by Female Poverty Among 25-34 Year Olds
In terms of female poverty among 25-34 year olds, the demographic groups most similar to Scotch-Irish are Barbadian (14.8%, a difference of 0.0%), Immigrants from Nicaragua (14.8%, a difference of 0.040%), Immigrants from Bangladesh (14.8%, a difference of 0.040%), Immigrants from Middle Africa (14.8%, a difference of 0.22%), and Immigrants from Grenada (14.7%, a difference of 0.26%).
| Demographics | Rating | Rank | Female Poverty Among 25-34 Year Olds |
| Cubans | 1.6 /100 | #234 | Tragic 14.7% |
| Immigrants | Jamaica | 1.4 /100 | #235 | Tragic 14.7% |
| Salvadorans | 1.4 /100 | #236 | Tragic 14.7% |
| Immigrants | Ghana | 1.4 /100 | #237 | Tragic 14.7% |
| Alsatians | 1.4 /100 | #238 | Tragic 14.7% |
| Malaysians | 1.4 /100 | #239 | Tragic 14.7% |
| Immigrants | Grenada | 1.3 /100 | #240 | Tragic 14.7% |
| Scotch-Irish | 1.2 /100 | #241 | Tragic 14.8% |
| Barbadians | 1.2 /100 | #242 | Tragic 14.8% |
| Immigrants | Nicaragua | 1.1 /100 | #243 | Tragic 14.8% |
| Immigrants | Bangladesh | 1.1 /100 | #244 | Tragic 14.8% |
| Immigrants | Middle Africa | 1.0 /100 | #245 | Tragic 14.8% |
| Jamaicans | 1.0 /100 | #246 | Tragic 14.8% |
| German Russians | 0.8 /100 | #247 | Tragic 14.9% |
| Immigrants | Western Africa | 0.8 /100 | #248 | Tragic 14.9% |
Demographics Similar to Immigrants from Liberia by Female Poverty Among 25-34 Year Olds
In terms of female poverty among 25-34 year olds, the demographic groups most similar to Immigrants from Liberia are Immigrants from Somalia (15.4%, a difference of 0.010%), Pennsylvania German (15.4%, a difference of 0.030%), Central American (15.5%, a difference of 0.39%), Mexican American Indian (15.4%, a difference of 0.47%), and Immigrants from Belize (15.3%, a difference of 0.71%).
| Demographics | Rating | Rank | Female Poverty Among 25-34 Year Olds |
| Nepalese | 0.2 /100 | #258 | Tragic 15.2% |
| Immigrants | Cuba | 0.2 /100 | #259 | Tragic 15.2% |
| Marshallese | 0.2 /100 | #260 | Tragic 15.3% |
| Liberians | 0.2 /100 | #261 | Tragic 15.3% |
| Immigrants | Belize | 0.2 /100 | #262 | Tragic 15.3% |
| Mexican American Indians | 0.2 /100 | #263 | Tragic 15.4% |
| Pennsylvania Germans | 0.1 /100 | #264 | Tragic 15.4% |
| Immigrants | Liberia | 0.1 /100 | #265 | Tragic 15.4% |
| Immigrants | Somalia | 0.1 /100 | #266 | Tragic 15.4% |
| Central Americans | 0.1 /100 | #267 | Tragic 15.5% |
| Immigrants | Senegal | 0.1 /100 | #268 | Tragic 15.6% |
| Sub-Saharan Africans | 0.1 /100 | #269 | Tragic 15.6% |
| British West Indians | 0.1 /100 | #270 | Tragic 15.6% |
| Cree | 0.1 /100 | #271 | Tragic 15.6% |
| Senegalese | 0.1 /100 | #272 | Tragic 15.6% |