Scotch-Irish vs Afghan Receiving Food Stamps
COMPARE
Scotch-Irish
Afghan
Receiving Food Stamps
Receiving Food Stamps Comparison
Scotch-Irish
Afghans
10.5%
RECEIVING FOOD STAMPS
95.1/ 100
METRIC RATING
114th/ 347
METRIC RANK
10.7%
RECEIVING FOOD STAMPS
92.6/ 100
METRIC RATING
126th/ 347
METRIC RANK
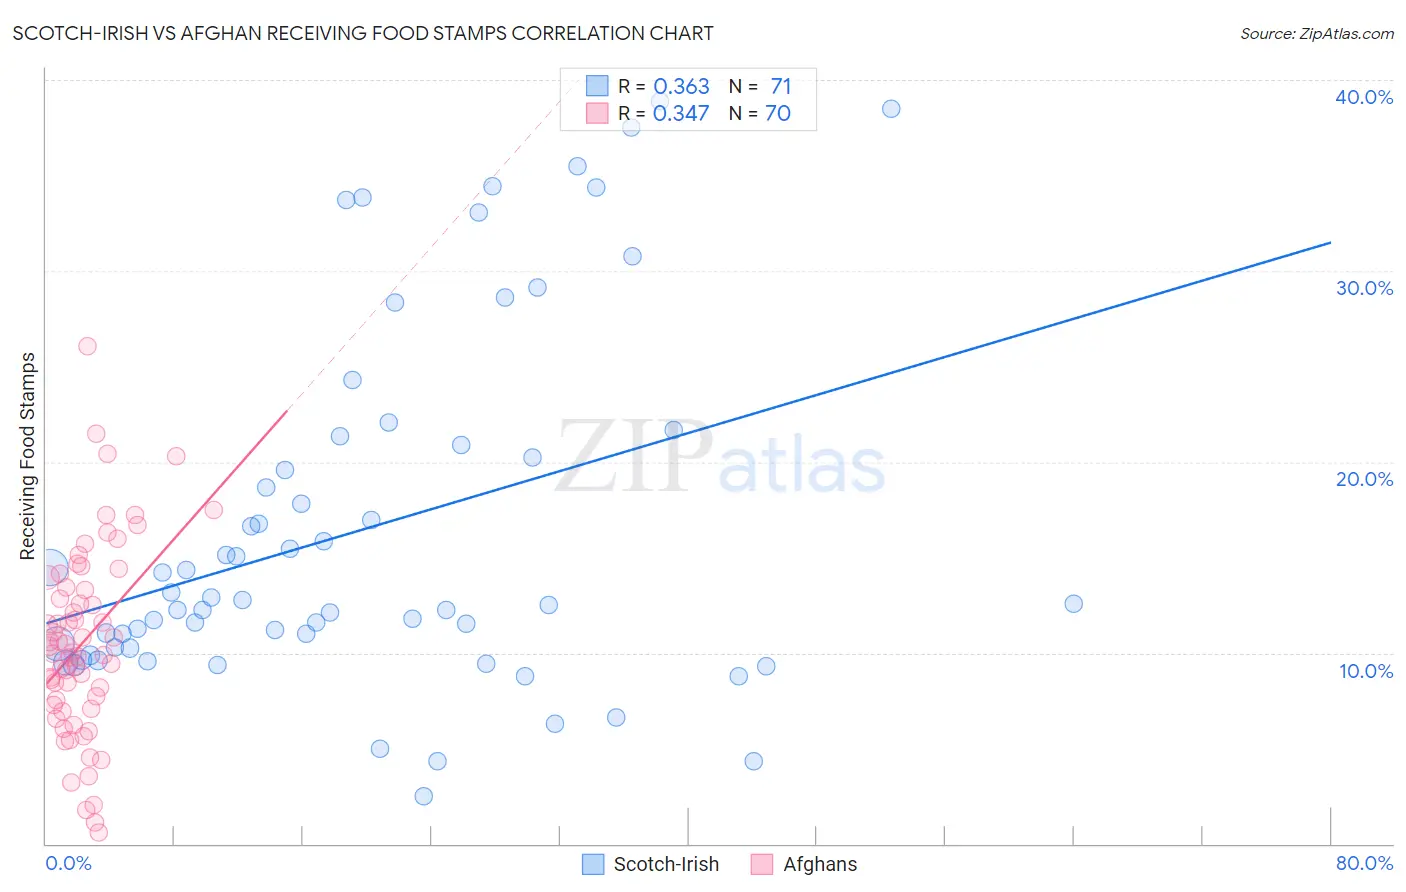
Scotch-Irish vs Afghan Receiving Food Stamps Correlation Chart
The statistical analysis conducted on geographies consisting of 546,022,543 people shows a mild positive correlation between the proportion of Scotch-Irish and percentage of population receiving government assistance and/or food stamps in the United States with a correlation coefficient (R) of 0.363 and weighted average of 10.5%. Similarly, the statistical analysis conducted on geographies consisting of 148,722,422 people shows a mild positive correlation between the proportion of Afghans and percentage of population receiving government assistance and/or food stamps in the United States with a correlation coefficient (R) of 0.347 and weighted average of 10.7%, a difference of 1.7%.
Receiving Food Stamps Correlation Summary
| Measurement | Scotch-Irish | Afghan |
| Minimum | 2.5% | 0.60% |
| Maximum | 38.9% | 26.1% |
| Range | 36.4% | 25.5% |
| Mean | 16.4% | 10.5% |
| Median | 12.6% | 10.2% |
| Interquartile 25% (IQ1) | 10.2% | 7.3% |
| Interquartile 75% (IQ3) | 20.9% | 13.4% |
| Interquartile Range (IQR) | 10.7% | 6.1% |
| Standard Deviation (Sample) | 9.3% | 5.0% |
| Standard Deviation (Population) | 9.2% | 4.9% |
Demographics Similar to Scotch-Irish and Afghans by Receiving Food Stamps
In terms of receiving food stamps, the demographic groups most similar to Scotch-Irish are Immigrants from Saudi Arabia (10.5%, a difference of 0.18%), Canadian (10.5%, a difference of 0.22%), Icelander (10.5%, a difference of 0.30%), Immigrants from Nepal (10.6%, a difference of 0.39%), and Mongolian (10.5%, a difference of 0.68%). Similarly, the demographic groups most similar to Afghans are Immigrants from Ethiopia (10.7%, a difference of 0.020%), Immigrants from Jordan (10.7%, a difference of 0.030%), Yugoslavian (10.7%, a difference of 0.030%), Israeli (10.7%, a difference of 0.13%), and Ukrainian (10.7%, a difference of 0.14%).
| Demographics | Rating | Rank | Receiving Food Stamps |
| Pakistanis | 95.9 /100 | #110 | Exceptional 10.4% |
| Romanians | 95.8 /100 | #111 | Exceptional 10.4% |
| Mongolians | 95.8 /100 | #112 | Exceptional 10.5% |
| Icelanders | 95.4 /100 | #113 | Exceptional 10.5% |
| Scotch-Irish | 95.1 /100 | #114 | Exceptional 10.5% |
| Immigrants | Saudi Arabia | 94.9 /100 | #115 | Exceptional 10.5% |
| Canadians | 94.8 /100 | #116 | Exceptional 10.5% |
| Immigrants | Nepal | 94.6 /100 | #117 | Exceptional 10.6% |
| Assyrians/Chaldeans/Syriacs | 94.1 /100 | #118 | Exceptional 10.6% |
| Immigrants | Poland | 93.9 /100 | #119 | Exceptional 10.6% |
| Ethiopians | 93.9 /100 | #120 | Exceptional 10.6% |
| Slavs | 93.8 /100 | #121 | Exceptional 10.6% |
| Sri Lankans | 93.7 /100 | #122 | Exceptional 10.6% |
| Immigrants | Philippines | 93.3 /100 | #123 | Exceptional 10.7% |
| Paraguayans | 93.0 /100 | #124 | Exceptional 10.7% |
| Ukrainians | 92.8 /100 | #125 | Exceptional 10.7% |
| Afghans | 92.6 /100 | #126 | Exceptional 10.7% |
| Immigrants | Ethiopia | 92.6 /100 | #127 | Exceptional 10.7% |
| Immigrants | Jordan | 92.5 /100 | #128 | Exceptional 10.7% |
| Yugoslavians | 92.5 /100 | #129 | Exceptional 10.7% |
| Israelis | 92.4 /100 | #130 | Exceptional 10.7% |