Scotch-Irish vs Afghan Seniors Poverty Over the Age of 75
COMPARE
Scotch-Irish
Afghan
Seniors Poverty Over the Age of 75
Seniors Poverty Over the Age of 75 Comparison
Scotch-Irish
Afghans
10.8%
SENIORS POVERTY OVER THE AGE OF 75
99.6/ 100
METRIC RATING
36th/ 347
METRIC RANK
11.2%
SENIORS POVERTY OVER THE AGE OF 75
98.2/ 100
METRIC RATING
54th/ 347
METRIC RANK
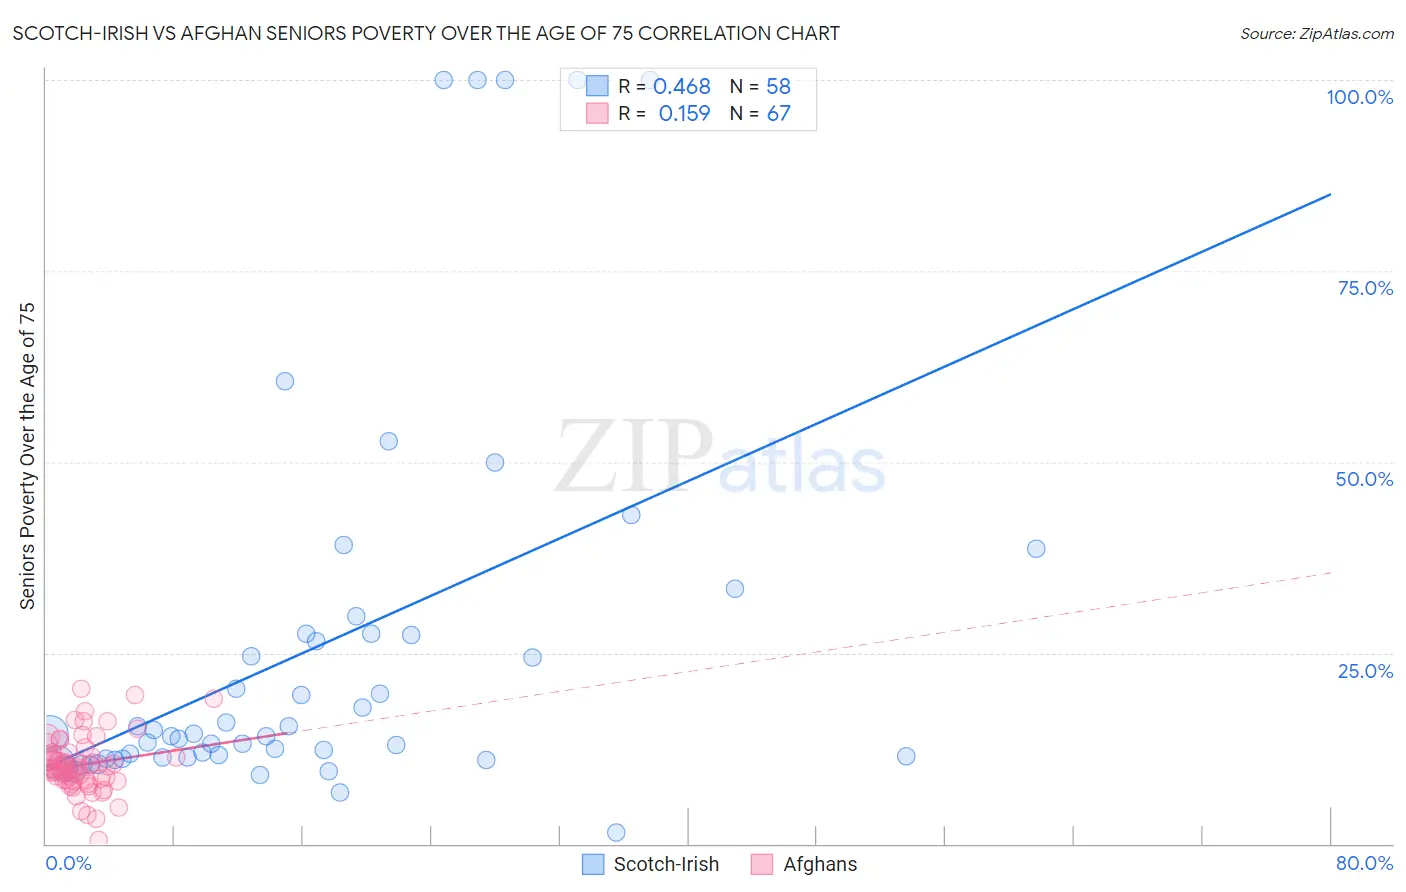
Scotch-Irish vs Afghan Seniors Poverty Over the Age of 75 Correlation Chart
The statistical analysis conducted on geographies consisting of 534,526,562 people shows a moderate positive correlation between the proportion of Scotch-Irish and poverty level among seniors over the age of 75 in the United States with a correlation coefficient (R) of 0.468 and weighted average of 10.8%. Similarly, the statistical analysis conducted on geographies consisting of 148,083,803 people shows a poor positive correlation between the proportion of Afghans and poverty level among seniors over the age of 75 in the United States with a correlation coefficient (R) of 0.159 and weighted average of 11.2%, a difference of 3.6%.
Seniors Poverty Over the Age of 75 Correlation Summary
| Measurement | Scotch-Irish | Afghan |
| Minimum | 1.4% | 0.56% |
| Maximum | 100.0% | 20.3% |
| Range | 98.6% | 19.7% |
| Mean | 25.7% | 10.4% |
| Median | 14.2% | 10.0% |
| Interquartile 25% (IQ1) | 11.2% | 8.3% |
| Interquartile 75% (IQ3) | 27.4% | 11.9% |
| Interquartile Range (IQR) | 16.2% | 3.7% |
| Standard Deviation (Sample) | 25.9% | 3.7% |
| Standard Deviation (Population) | 25.6% | 3.7% |
Demographics Similar to Scotch-Irish and Afghans by Seniors Poverty Over the Age of 75
In terms of seniors poverty over the age of 75, the demographic groups most similar to Scotch-Irish are Luxembourger (10.8%, a difference of 0.050%), Latvian (10.8%, a difference of 0.16%), Finnish (10.8%, a difference of 0.30%), Czechoslovakian (10.9%, a difference of 0.93%), and Thai (10.9%, a difference of 1.1%). Similarly, the demographic groups most similar to Afghans are Hungarian (11.2%, a difference of 0.070%), Immigrants from England (11.2%, a difference of 0.32%), Zimbabwean (11.2%, a difference of 0.38%), Immigrants from North Macedonia (11.1%, a difference of 0.54%), and Serbian (11.1%, a difference of 0.57%).
| Demographics | Rating | Rank | Seniors Poverty Over the Age of 75 |
| Luxembourgers | 99.6 /100 | #35 | Exceptional 10.8% |
| Scotch-Irish | 99.6 /100 | #36 | Exceptional 10.8% |
| Latvians | 99.6 /100 | #37 | Exceptional 10.8% |
| Finns | 99.6 /100 | #38 | Exceptional 10.8% |
| Czechoslovakians | 99.4 /100 | #39 | Exceptional 10.9% |
| Thais | 99.4 /100 | #40 | Exceptional 10.9% |
| Immigrants | Lithuania | 99.2 /100 | #41 | Exceptional 11.0% |
| Austrians | 99.1 /100 | #42 | Exceptional 11.0% |
| Celtics | 99.1 /100 | #43 | Exceptional 11.0% |
| Belgians | 99.1 /100 | #44 | Exceptional 11.0% |
| Carpatho Rusyns | 99.0 /100 | #45 | Exceptional 11.1% |
| Greeks | 99.0 /100 | #46 | Exceptional 11.1% |
| Hawaiians | 98.8 /100 | #47 | Exceptional 11.1% |
| French | 98.7 /100 | #48 | Exceptional 11.1% |
| Samoans | 98.7 /100 | #49 | Exceptional 11.1% |
| Serbians | 98.6 /100 | #50 | Exceptional 11.1% |
| Immigrants | North Macedonia | 98.6 /100 | #51 | Exceptional 11.1% |
| Zimbabweans | 98.5 /100 | #52 | Exceptional 11.2% |
| Immigrants | England | 98.4 /100 | #53 | Exceptional 11.2% |
| Afghans | 98.2 /100 | #54 | Exceptional 11.2% |
| Hungarians | 98.1 /100 | #55 | Exceptional 11.2% |