Immigrants from Philippines vs Afghan Receiving Food Stamps
COMPARE
Immigrants from Philippines
Afghan
Receiving Food Stamps
Receiving Food Stamps Comparison
Immigrants from Philippines
Afghans
10.7%
RECEIVING FOOD STAMPS
93.3/ 100
METRIC RATING
123rd/ 347
METRIC RANK
10.7%
RECEIVING FOOD STAMPS
92.6/ 100
METRIC RATING
126th/ 347
METRIC RANK
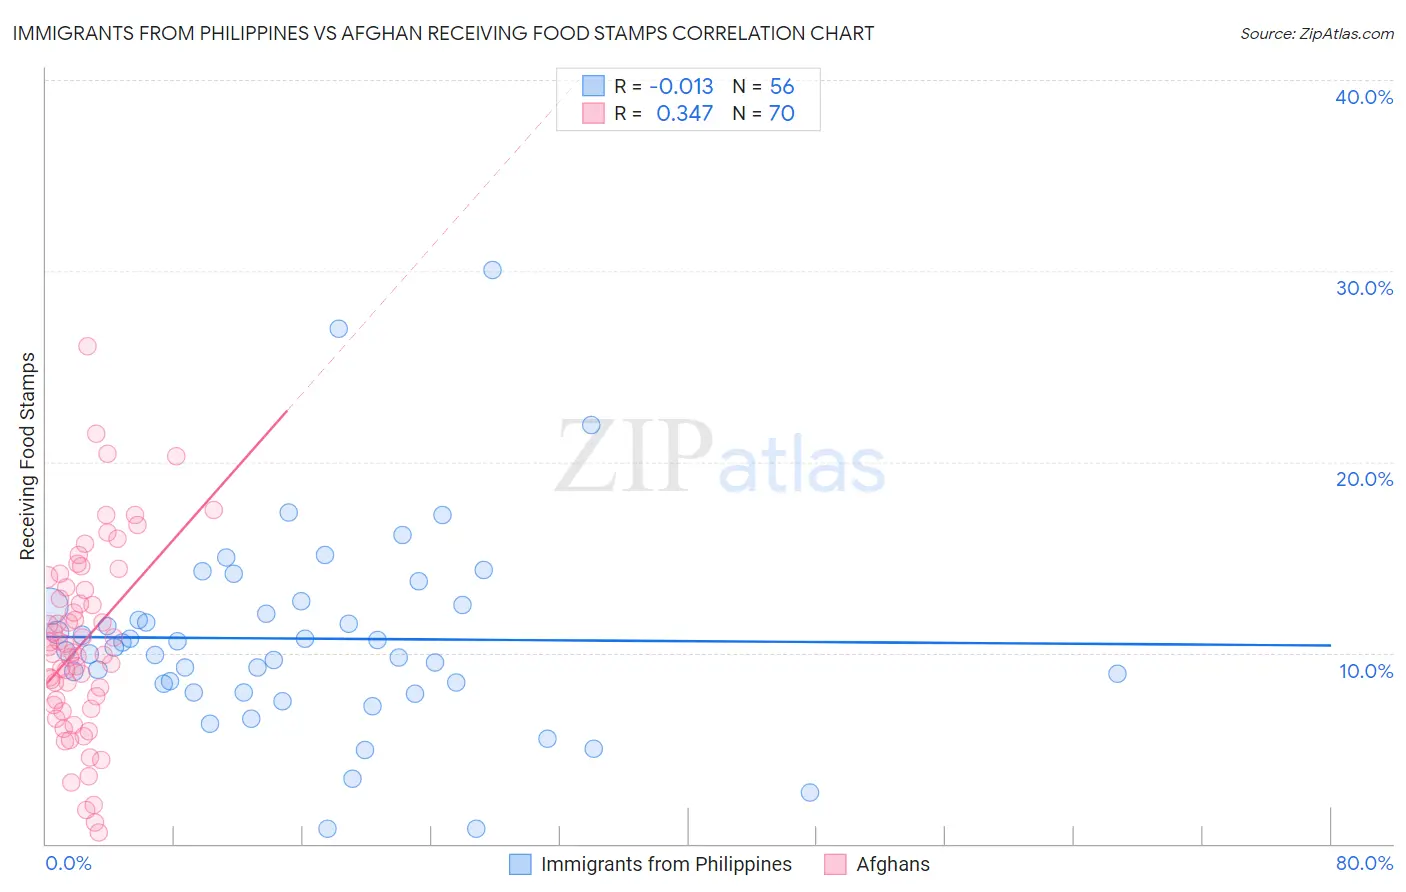
Immigrants from Philippines vs Afghan Receiving Food Stamps Correlation Chart
The statistical analysis conducted on geographies consisting of 469,841,881 people shows no correlation between the proportion of Immigrants from Philippines and percentage of population receiving government assistance and/or food stamps in the United States with a correlation coefficient (R) of -0.013 and weighted average of 10.7%. Similarly, the statistical analysis conducted on geographies consisting of 148,722,422 people shows a mild positive correlation between the proportion of Afghans and percentage of population receiving government assistance and/or food stamps in the United States with a correlation coefficient (R) of 0.347 and weighted average of 10.7%, a difference of 0.43%.
Receiving Food Stamps Correlation Summary
| Measurement | Immigrants from Philippines | Afghan |
| Minimum | 0.80% | 0.60% |
| Maximum | 30.1% | 26.1% |
| Range | 29.3% | 25.5% |
| Mean | 10.7% | 10.5% |
| Median | 10.2% | 10.2% |
| Interquartile 25% (IQ1) | 8.1% | 7.3% |
| Interquartile 75% (IQ3) | 12.5% | 13.4% |
| Interquartile Range (IQR) | 4.3% | 6.1% |
| Standard Deviation (Sample) | 5.2% | 5.0% |
| Standard Deviation (Population) | 5.2% | 4.9% |
Demographics Similar to Immigrants from Philippines and Afghans by Receiving Food Stamps
In terms of receiving food stamps, the demographic groups most similar to Immigrants from Philippines are Paraguayan (10.7%, a difference of 0.21%), Sri Lankan (10.6%, a difference of 0.25%), Ukrainian (10.7%, a difference of 0.29%), Slavic (10.6%, a difference of 0.33%), and Immigrants from Poland (10.6%, a difference of 0.36%). Similarly, the demographic groups most similar to Afghans are Immigrants from Ethiopia (10.7%, a difference of 0.020%), Immigrants from Jordan (10.7%, a difference of 0.030%), Yugoslavian (10.7%, a difference of 0.030%), Israeli (10.7%, a difference of 0.13%), and Ukrainian (10.7%, a difference of 0.14%).
| Demographics | Rating | Rank | Receiving Food Stamps |
| Scotch-Irish | 95.1 /100 | #114 | Exceptional 10.5% |
| Immigrants | Saudi Arabia | 94.9 /100 | #115 | Exceptional 10.5% |
| Canadians | 94.8 /100 | #116 | Exceptional 10.5% |
| Immigrants | Nepal | 94.6 /100 | #117 | Exceptional 10.6% |
| Assyrians/Chaldeans/Syriacs | 94.1 /100 | #118 | Exceptional 10.6% |
| Immigrants | Poland | 93.9 /100 | #119 | Exceptional 10.6% |
| Ethiopians | 93.9 /100 | #120 | Exceptional 10.6% |
| Slavs | 93.8 /100 | #121 | Exceptional 10.6% |
| Sri Lankans | 93.7 /100 | #122 | Exceptional 10.6% |
| Immigrants | Philippines | 93.3 /100 | #123 | Exceptional 10.7% |
| Paraguayans | 93.0 /100 | #124 | Exceptional 10.7% |
| Ukrainians | 92.8 /100 | #125 | Exceptional 10.7% |
| Afghans | 92.6 /100 | #126 | Exceptional 10.7% |
| Immigrants | Ethiopia | 92.6 /100 | #127 | Exceptional 10.7% |
| Immigrants | Jordan | 92.5 /100 | #128 | Exceptional 10.7% |
| Yugoslavians | 92.5 /100 | #129 | Exceptional 10.7% |
| Israelis | 92.4 /100 | #130 | Exceptional 10.7% |
| French | 92.3 /100 | #131 | Exceptional 10.7% |
| Immigrants | Germany | 92.0 /100 | #132 | Exceptional 10.7% |
| Immigrants | Russia | 90.9 /100 | #133 | Exceptional 10.8% |
| Immigrants | Brazil | 90.3 /100 | #134 | Exceptional 10.8% |