Scandinavian vs Central American Indian Poverty
COMPARE
Scandinavian
Central American Indian
Poverty
Poverty Comparison
Scandinavians
Central American Indians
11.1%
POVERTY
98.2/ 100
METRIC RATING
57th/ 347
METRIC RANK
16.7%
POVERTY
0.0/ 100
METRIC RATING
325th/ 347
METRIC RANK
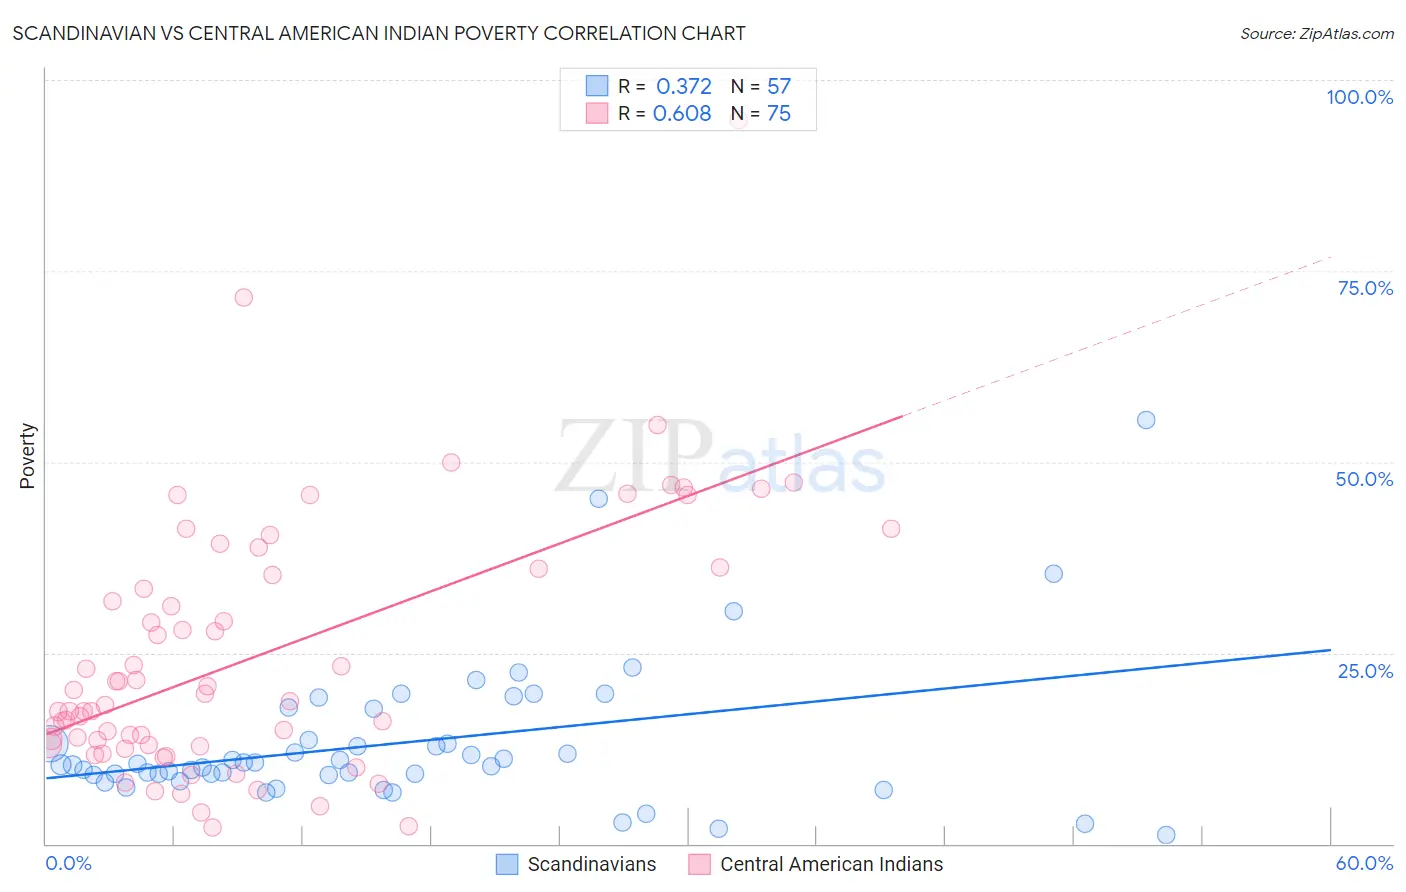
Scandinavian vs Central American Indian Poverty Correlation Chart
The statistical analysis conducted on geographies consisting of 472,236,083 people shows a mild positive correlation between the proportion of Scandinavians and poverty level in the United States with a correlation coefficient (R) of 0.372 and weighted average of 11.1%. Similarly, the statistical analysis conducted on geographies consisting of 326,078,193 people shows a significant positive correlation between the proportion of Central American Indians and poverty level in the United States with a correlation coefficient (R) of 0.608 and weighted average of 16.7%, a difference of 50.0%.
Poverty Correlation Summary
| Measurement | Scandinavian | Central American Indian |
| Minimum | 1.1% | 2.1% |
| Maximum | 55.6% | 94.8% |
| Range | 54.4% | 92.7% |
| Mean | 13.2% | 24.6% |
| Median | 10.3% | 18.6% |
| Interquartile 25% (IQ1) | 9.0% | 12.9% |
| Interquartile 75% (IQ3) | 15.7% | 36.0% |
| Interquartile Range (IQR) | 6.7% | 23.1% |
| Standard Deviation (Sample) | 9.6% | 16.9% |
| Standard Deviation (Population) | 9.6% | 16.8% |
Similar Demographics by Poverty
Demographics Similar to Scandinavians by Poverty
In terms of poverty, the demographic groups most similar to Scandinavians are Estonian (11.1%, a difference of 0.040%), German (11.1%, a difference of 0.060%), Immigrants from Europe (11.2%, a difference of 0.21%), Immigrants from Sri Lanka (11.2%, a difference of 0.37%), and Immigrants from Italy (11.2%, a difference of 0.44%).
| Demographics | Rating | Rank | Poverty |
| Asians | 98.9 /100 | #50 | Exceptional 11.0% |
| Immigrants | Croatia | 98.7 /100 | #51 | Exceptional 11.0% |
| Immigrants | Philippines | 98.7 /100 | #52 | Exceptional 11.0% |
| Immigrants | Austria | 98.6 /100 | #53 | Exceptional 11.1% |
| Immigrants | Bulgaria | 98.5 /100 | #54 | Exceptional 11.1% |
| Immigrants | Serbia | 98.5 /100 | #55 | Exceptional 11.1% |
| Estonians | 98.2 /100 | #56 | Exceptional 11.1% |
| Scandinavians | 98.2 /100 | #57 | Exceptional 11.1% |
| Germans | 98.1 /100 | #58 | Exceptional 11.1% |
| Immigrants | Europe | 98.0 /100 | #59 | Exceptional 11.2% |
| Immigrants | Sri Lanka | 97.9 /100 | #60 | Exceptional 11.2% |
| Immigrants | Italy | 97.9 /100 | #61 | Exceptional 11.2% |
| Austrians | 97.8 /100 | #62 | Exceptional 11.2% |
| Ukrainians | 97.8 /100 | #63 | Exceptional 11.2% |
| Swiss | 97.7 /100 | #64 | Exceptional 11.2% |
Demographics Similar to Central American Indians by Poverty
In terms of poverty, the demographic groups most similar to Central American Indians are Yakama (16.7%, a difference of 0.23%), Paiute (16.7%, a difference of 0.29%), Colville (16.6%, a difference of 0.77%), Kiowa (16.8%, a difference of 0.82%), and Ute (16.9%, a difference of 1.3%).
| Demographics | Rating | Rank | Poverty |
| Immigrants | Dominica | 0.0 /100 | #318 | Tragic 16.1% |
| Immigrants | Congo | 0.0 /100 | #319 | Tragic 16.1% |
| Immigrants | Honduras | 0.0 /100 | #320 | Tragic 16.2% |
| Arapaho | 0.0 /100 | #321 | Tragic 16.3% |
| Menominee | 0.0 /100 | #322 | Tragic 16.4% |
| Colville | 0.0 /100 | #323 | Tragic 16.6% |
| Yakama | 0.0 /100 | #324 | Tragic 16.7% |
| Central American Indians | 0.0 /100 | #325 | Tragic 16.7% |
| Paiute | 0.0 /100 | #326 | Tragic 16.7% |
| Kiowa | 0.0 /100 | #327 | Tragic 16.8% |
| Ute | 0.0 /100 | #328 | Tragic 16.9% |
| Blacks/African Americans | 0.0 /100 | #329 | Tragic 17.3% |
| Dominicans | 0.0 /100 | #330 | Tragic 17.6% |
| Immigrants | Dominican Republic | 0.0 /100 | #331 | Tragic 17.8% |
| Natives/Alaskans | 0.0 /100 | #332 | Tragic 18.1% |