Scandinavian vs Central American Indian Median Family Income
COMPARE
Scandinavian
Central American Indian
Median Family Income
Median Family Income Comparison
Scandinavians
Central American Indians
$104,410
MEDIAN FAMILY INCOME
70.8/ 100
METRIC RATING
158th/ 347
METRIC RANK
$88,034
MEDIAN FAMILY INCOME
0.1/ 100
METRIC RATING
289th/ 347
METRIC RANK
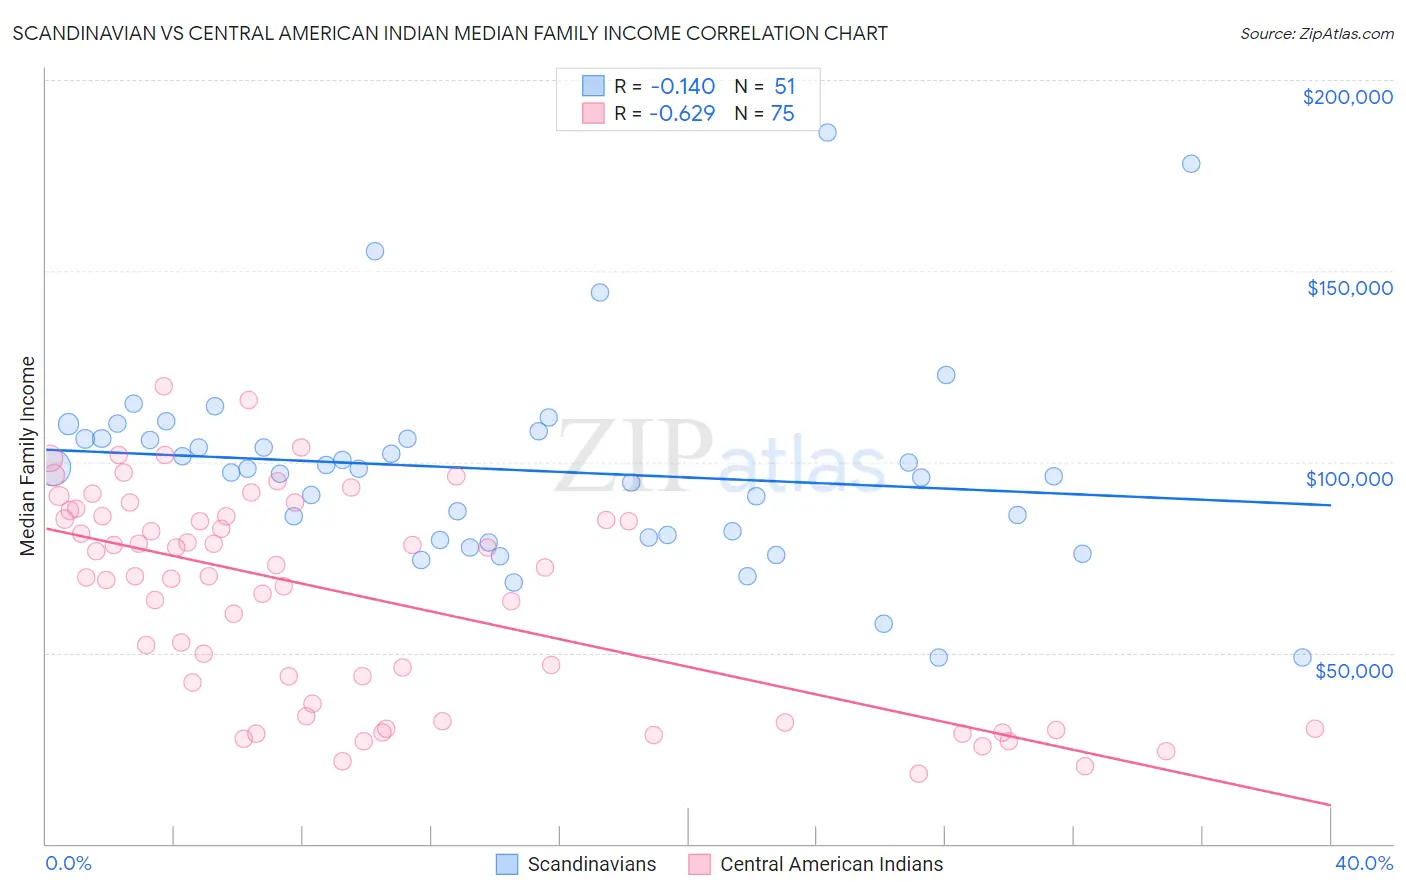
Scandinavian vs Central American Indian Median Family Income Correlation Chart
The statistical analysis conducted on geographies consisting of 472,034,552 people shows a poor negative correlation between the proportion of Scandinavians and median family income in the United States with a correlation coefficient (R) of -0.140 and weighted average of $104,410. Similarly, the statistical analysis conducted on geographies consisting of 326,005,427 people shows a significant negative correlation between the proportion of Central American Indians and median family income in the United States with a correlation coefficient (R) of -0.629 and weighted average of $88,034, a difference of 18.6%.
Median Family Income Correlation Summary
| Measurement | Scandinavian | Central American Indian |
| Minimum | $48,750 | $18,167 |
| Maximum | $186,250 | $119,681 |
| Range | $137,500 | $101,514 |
| Mean | $97,868 | $65,085 |
| Median | $98,046 | $70,092 |
| Interquartile 25% (IQ1) | $80,113 | $33,434 |
| Interquartile 75% (IQ3) | $106,098 | $85,864 |
| Interquartile Range (IQR) | $25,985 | $52,430 |
| Standard Deviation (Sample) | $26,299 | $27,378 |
| Standard Deviation (Population) | $26,040 | $27,195 |
Similar Demographics by Median Family Income
Demographics Similar to Scandinavians by Median Family Income
In terms of median family income, the demographic groups most similar to Scandinavians are Swiss ($104,396, a difference of 0.010%), Moroccan ($104,488, a difference of 0.080%), Scottish ($104,288, a difference of 0.12%), Icelander ($104,282, a difference of 0.12%), and Basque ($104,760, a difference of 0.34%).
| Demographics | Rating | Rank | Median Family Income |
| Peruvians | 80.4 /100 | #151 | Excellent $105,444 |
| Immigrants | Albania | 79.1 /100 | #152 | Good $105,285 |
| Slavs | 77.9 /100 | #153 | Good $105,144 |
| Immigrants | Nepal | 76.3 /100 | #154 | Good $104,966 |
| Native Hawaiians | 75.8 /100 | #155 | Good $104,910 |
| Basques | 74.4 /100 | #156 | Good $104,760 |
| Moroccans | 71.6 /100 | #157 | Good $104,488 |
| Scandinavians | 70.8 /100 | #158 | Good $104,410 |
| Swiss | 70.7 /100 | #159 | Good $104,396 |
| Scottish | 69.5 /100 | #160 | Good $104,288 |
| Icelanders | 69.4 /100 | #161 | Good $104,282 |
| Immigrants | Sierra Leone | 66.2 /100 | #162 | Good $103,990 |
| Costa Ricans | 66.2 /100 | #163 | Good $103,989 |
| Sierra Leoneans | 64.7 /100 | #164 | Good $103,859 |
| Slovaks | 63.1 /100 | #165 | Good $103,729 |
Demographics Similar to Central American Indians by Median Family Income
In terms of median family income, the demographic groups most similar to Central American Indians are Shoshone ($87,872, a difference of 0.19%), Cherokee ($88,209, a difference of 0.20%), Immigrants from Cabo Verde ($87,830, a difference of 0.23%), African ($87,820, a difference of 0.24%), and Immigrants from Nicaragua ($88,267, a difference of 0.26%).
| Demographics | Rating | Rank | Median Family Income |
| Comanche | 0.1 /100 | #282 | Tragic $88,556 |
| Bangladeshis | 0.1 /100 | #283 | Tragic $88,358 |
| Indonesians | 0.1 /100 | #284 | Tragic $88,301 |
| Guatemalans | 0.1 /100 | #285 | Tragic $88,295 |
| Immigrants | Nicaragua | 0.1 /100 | #286 | Tragic $88,267 |
| Potawatomi | 0.1 /100 | #287 | Tragic $88,265 |
| Cherokee | 0.1 /100 | #288 | Tragic $88,209 |
| Central American Indians | 0.1 /100 | #289 | Tragic $88,034 |
| Shoshone | 0.1 /100 | #290 | Tragic $87,872 |
| Immigrants | Cabo Verde | 0.1 /100 | #291 | Tragic $87,830 |
| Africans | 0.1 /100 | #292 | Tragic $87,820 |
| Ute | 0.0 /100 | #293 | Tragic $87,596 |
| Fijians | 0.0 /100 | #294 | Tragic $87,387 |
| Yaqui | 0.0 /100 | #295 | Tragic $87,289 |
| Immigrants | Guatemala | 0.0 /100 | #296 | Tragic $87,191 |