Scandinavian vs Immigrants from Scotland Poverty
COMPARE
Scandinavian
Immigrants from Scotland
Poverty
Poverty Comparison
Scandinavians
Immigrants from Scotland
11.1%
POVERTY
98.2/ 100
METRIC RATING
57th/ 347
METRIC RANK
10.6%
POVERTY
99.7/ 100
METRIC RATING
19th/ 347
METRIC RANK
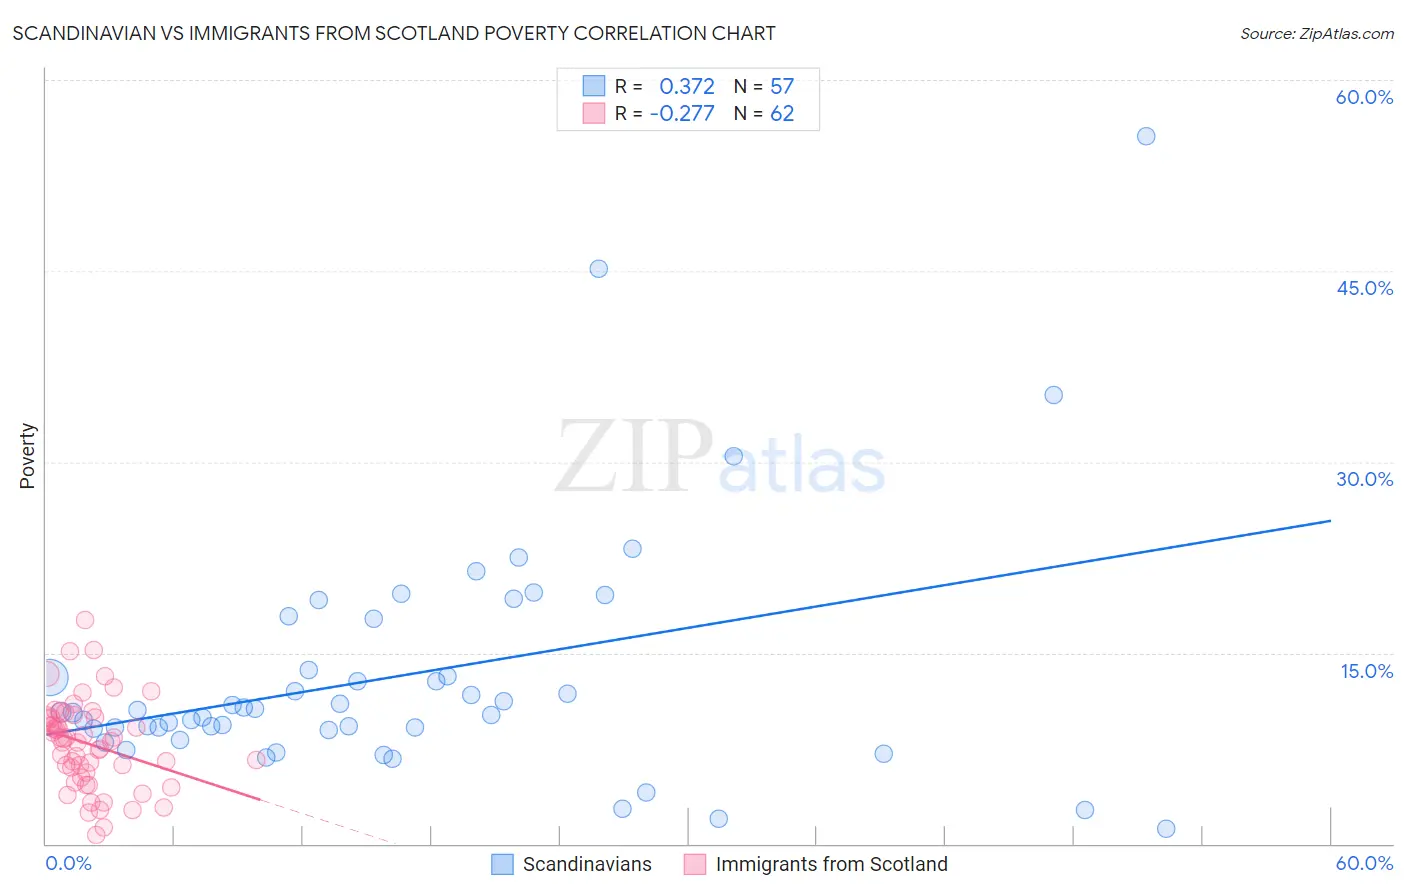
Scandinavian vs Immigrants from Scotland Poverty Correlation Chart
The statistical analysis conducted on geographies consisting of 472,236,083 people shows a mild positive correlation between the proportion of Scandinavians and poverty level in the United States with a correlation coefficient (R) of 0.372 and weighted average of 11.1%. Similarly, the statistical analysis conducted on geographies consisting of 196,384,756 people shows a weak negative correlation between the proportion of Immigrants from Scotland and poverty level in the United States with a correlation coefficient (R) of -0.277 and weighted average of 10.6%, a difference of 5.4%.
Poverty Correlation Summary
| Measurement | Scandinavian | Immigrants from Scotland |
| Minimum | 1.1% | 0.74% |
| Maximum | 55.6% | 17.6% |
| Range | 54.4% | 16.8% |
| Mean | 13.2% | 7.8% |
| Median | 10.3% | 8.2% |
| Interquartile 25% (IQ1) | 9.0% | 5.6% |
| Interquartile 75% (IQ3) | 15.7% | 9.9% |
| Interquartile Range (IQR) | 6.7% | 4.4% |
| Standard Deviation (Sample) | 9.6% | 3.5% |
| Standard Deviation (Population) | 9.6% | 3.4% |
Similar Demographics by Poverty
Demographics Similar to Scandinavians by Poverty
In terms of poverty, the demographic groups most similar to Scandinavians are Estonian (11.1%, a difference of 0.040%), German (11.1%, a difference of 0.060%), Immigrants from Europe (11.2%, a difference of 0.21%), Immigrants from Sri Lanka (11.2%, a difference of 0.37%), and Immigrants from Italy (11.2%, a difference of 0.44%).
| Demographics | Rating | Rank | Poverty |
| Asians | 98.9 /100 | #50 | Exceptional 11.0% |
| Immigrants | Croatia | 98.7 /100 | #51 | Exceptional 11.0% |
| Immigrants | Philippines | 98.7 /100 | #52 | Exceptional 11.0% |
| Immigrants | Austria | 98.6 /100 | #53 | Exceptional 11.1% |
| Immigrants | Bulgaria | 98.5 /100 | #54 | Exceptional 11.1% |
| Immigrants | Serbia | 98.5 /100 | #55 | Exceptional 11.1% |
| Estonians | 98.2 /100 | #56 | Exceptional 11.1% |
| Scandinavians | 98.2 /100 | #57 | Exceptional 11.1% |
| Germans | 98.1 /100 | #58 | Exceptional 11.1% |
| Immigrants | Europe | 98.0 /100 | #59 | Exceptional 11.2% |
| Immigrants | Sri Lanka | 97.9 /100 | #60 | Exceptional 11.2% |
| Immigrants | Italy | 97.9 /100 | #61 | Exceptional 11.2% |
| Austrians | 97.8 /100 | #62 | Exceptional 11.2% |
| Ukrainians | 97.8 /100 | #63 | Exceptional 11.2% |
| Swiss | 97.7 /100 | #64 | Exceptional 11.2% |
Demographics Similar to Immigrants from Scotland by Poverty
In terms of poverty, the demographic groups most similar to Immigrants from Scotland are Immigrants from North Macedonia (10.6%, a difference of 0.11%), Luxembourger (10.6%, a difference of 0.19%), Eastern European (10.6%, a difference of 0.35%), Latvian (10.5%, a difference of 0.39%), and Swedish (10.6%, a difference of 0.46%).
| Demographics | Rating | Rank | Poverty |
| Bhutanese | 99.8 /100 | #12 | Exceptional 10.4% |
| Immigrants | Hong Kong | 99.8 /100 | #13 | Exceptional 10.4% |
| Immigrants | Bolivia | 99.8 /100 | #14 | Exceptional 10.4% |
| Bolivians | 99.8 /100 | #15 | Exceptional 10.4% |
| Lithuanians | 99.8 /100 | #16 | Exceptional 10.5% |
| Norwegians | 99.8 /100 | #17 | Exceptional 10.5% |
| Latvians | 99.8 /100 | #18 | Exceptional 10.5% |
| Immigrants | Scotland | 99.7 /100 | #19 | Exceptional 10.6% |
| Immigrants | North Macedonia | 99.7 /100 | #20 | Exceptional 10.6% |
| Luxembourgers | 99.7 /100 | #21 | Exceptional 10.6% |
| Eastern Europeans | 99.7 /100 | #22 | Exceptional 10.6% |
| Swedes | 99.7 /100 | #23 | Exceptional 10.6% |
| Italians | 99.7 /100 | #24 | Exceptional 10.6% |
| Croatians | 99.6 /100 | #25 | Exceptional 10.6% |
| Burmese | 99.6 /100 | #26 | Exceptional 10.7% |