Samoan vs African Receiving Food Stamps

COMPARE

Samoan
Race
Ancestry
AfghanAlaska NativeAlaskan AthabascanAlbanianAleutAlsatianAmericanApacheArabArapahoArgentineanArmenianAssyrian/Chaldean/SyriacAustralianAustrianBahamianBangladeshiBarbadianBasqueBelgianBelizeanBermudanBhutaneseBlackfeetBolivianBrazilianBritishBritish West IndianBulgarianBurmeseCajunCambodianCanadianCape VerdeanCarpatho RusynCelticCentral AmericanCentral American IndianCherokeeCheyenneChickasawChileanChineseChippewaChoctawColombianColvilleComancheCosta RicanCreeCreekCroatianCrowCubanCypriotCzechCzechoslovakianDanishDelawareDominicanDutchDutch West IndianEastern EuropeanEcuadorianEgyptianEnglishEstonianEthiopianEuropeanFijianFilipinoFinnishFrenchFrench American IndianFrench CanadianGermanGerman RussianGhanaianGreekGuamanian/ChamorroGuatemalanGuyaneseHaitianHmongHonduranHopiHoumaHungarianIcelanderIndian (Asian)IndonesianInupiatIranianIraqiIrishIroquoisIsraeliItalianJamaicanJapaneseJordanianKenyanKiowaKoreanLaotianLatvianLebaneseLiberianLithuanianLumbeeLuxembourgerMacedonianMalaysianMalteseMarshalleseMenomineeMexicanMexican American IndianMongolianMoroccanNative HawaiianNavajoNepaleseNew ZealanderNicaraguanNigerianNorthern EuropeanNorwegianOkinawanOsageOttawaPaiutePakistaniPalestinianPanamanianParaguayanPennsylvania GermanPeruvianPimaPolishPortuguesePotawatomiPuebloPuerto RicanPuget Sound SalishRomanianRussianSalvadoranSamoanScandinavianScotch-IrishScottishSeminoleSenegaleseSerbianShoshoneSierra LeoneanSiouxSlavicSlovakSloveneSomaliSouth AfricanSouth AmericanSouth American IndianSoviet UnionSpaniardSpanishSpanish AmericanSpanish American IndianSri LankanSubsaharan AfricanSudaneseSwedishSwissSyrianTaiwaneseThaiTlingit-HaidaTohono O'OdhamTonganTrinidadian and TobagonianTsimshianTurkishU.S. Virgin IslanderUgandanUkrainianUruguayanUteVenezuelanVietnameseWelshWest IndianYakamaYaquiYugoslavianYumanYup'ikZimbabwean
Immigration
NonimmigrantsImmigrantsAfghanistanAfricaAlbaniaArgentinaArmeniaAsiaAustraliaAustriaBahamasBangladeshBarbadosBelarusBelgiumBelizeBoliviaBosnia and HerzegovinaBrazilBulgariaBurma/MyanmarCabo VerdeCambodiaCameroonCanadaCaribbeanCentral AmericaChileChinaColombiaCongoCosta RicaCroatiaCubaCzechoslovakiaDenmarkDominicaDominican RepublicEastern AfricaEastern AsiaEastern EuropeEcuadorEgyptEl SalvadorEnglandEritreaEthiopiaEuropeFijiFranceGermanyGhanaGreeceGrenadaGuatemalaGuyanaHaitiHondurasHong KongHungaryIndiaIndonesiaIranIraqIrelandIsraelItalyJamaicaJapanJordanKazakhstanKenyaKoreaKuwaitLaosLatin AmericaLatviaLebanonLiberiaLithuaniaMalaysiaMexicoMicronesiaMiddle AfricaMoldovaMoroccoNepalNetherlandsNicaraguaNigeriaNorth AmericaNorth MacedoniaNorthern AfricaNorthern EuropeNorwayOceaniaPakistanPanamaPeruPhilippinesPolandPortugalRomaniaRussiaSaudi ArabiaScotlandSenegalSerbiaSierra LeoneSingaporeSomaliaSouth AfricaSouth AmericaSouth Central AsiaSouth Eastern AsiaSouthern EuropeSpainSri LankaSt. Vincent and the GrenadinesSudanSwedenSwitzerlandSyriaTaiwanThailandTrinidad and TobagoTurkeyUgandaUkraineUruguayUzbekistanVenezuelaVietnamWest IndiesWestern AfricaWestern AsiaWestern EuropeYemenZaireZimbabweAzores
African
Race
Ancestry
AfghanAfricanAlaska NativeAlaskan AthabascanAlbanianAleutAlsatianAmericanApacheArabArapahoArgentineanArmenianAssyrian/Chaldean/SyriacAustralianAustrianBahamianBangladeshiBarbadianBasqueBelgianBelizeanBermudanBhutaneseBlackfeetBolivianBrazilianBritishBritish West IndianBulgarianBurmeseCajunCambodianCanadianCape VerdeanCarpatho RusynCelticCentral AmericanCentral American IndianCherokeeCheyenneChickasawChileanChineseChippewaChoctawColombianColvilleComancheCosta RicanCreeCreekCroatianCrowCubanCypriotCzechCzechoslovakianDanishDelawareDominicanDutchDutch West IndianEastern EuropeanEcuadorianEgyptianEnglishEstonianEthiopianEuropeanFijianFilipinoFinnishFrenchFrench American IndianFrench CanadianGermanGerman RussianGhanaianGreekGuamanian/ChamorroGuatemalanGuyaneseHaitianHmongHonduranHopiHoumaHungarianIcelanderIndian (Asian)IndonesianInupiatIranianIraqiIrishIroquoisIsraeliItalianJamaicanJapaneseJordanianKenyanKiowaKoreanLaotianLatvianLebaneseLiberianLithuanianLumbeeLuxembourgerMacedonianMalaysianMalteseMarshalleseMenomineeMexicanMexican American IndianMongolianMoroccanNative HawaiianNavajoNepaleseNew ZealanderNicaraguanNigerianNorthern EuropeanNorwegianOkinawanOsageOttawaPaiutePakistaniPalestinianPanamanianParaguayanPennsylvania GermanPeruvianPimaPolishPortuguesePotawatomiPuebloPuerto RicanPuget Sound SalishRomanianRussianSalvadoranScandinavianScotch-IrishScottishSeminoleSenegaleseSerbianShoshoneSierra LeoneanSiouxSlavicSlovakSloveneSomaliSouth AfricanSouth AmericanSouth American IndianSoviet UnionSpaniardSpanishSpanish AmericanSpanish American IndianSri LankanSubsaharan AfricanSudaneseSwedishSwissSyrianTaiwaneseThaiTlingit-HaidaTohono O'OdhamTonganTrinidadian and TobagonianTsimshianTurkishU.S. Virgin IslanderUgandanUkrainianUruguayanUteVenezuelanVietnameseWelshWest IndianYakamaYaquiYugoslavianYumanYup'ikZimbabwean
Immigration
NonimmigrantsImmigrantsAfghanistanAfricaAlbaniaArgentinaArmeniaAsiaAustraliaAustriaBahamasBangladeshBarbadosBelarusBelgiumBelizeBoliviaBosnia and HerzegovinaBrazilBulgariaBurma/MyanmarCabo VerdeCambodiaCameroonCanadaCaribbeanCentral AmericaChileChinaColombiaCongoCosta RicaCroatiaCubaCzechoslovakiaDenmarkDominicaDominican RepublicEastern AfricaEastern AsiaEastern EuropeEcuadorEgyptEl SalvadorEnglandEritreaEthiopiaEuropeFijiFranceGermanyGhanaGreeceGrenadaGuatemalaGuyanaHaitiHondurasHong KongHungaryIndiaIndonesiaIranIraqIrelandIsraelItalyJamaicaJapanJordanKazakhstanKenyaKoreaKuwaitLaosLatin AmericaLatviaLebanonLiberiaLithuaniaMalaysiaMexicoMicronesiaMiddle AfricaMoldovaMoroccoNepalNetherlandsNicaraguaNigeriaNorth AmericaNorth MacedoniaNorthern AfricaNorthern EuropeNorwayOceaniaPakistanPanamaPeruPhilippinesPolandPortugalRomaniaRussiaSaudi ArabiaScotlandSenegalSerbiaSierra LeoneSingaporeSomaliaSouth AfricaSouth AmericaSouth Central AsiaSouth Eastern AsiaSouthern EuropeSpainSri LankaSt. Vincent and the GrenadinesSudanSwedenSwitzerlandSyriaTaiwanThailandTrinidad and TobagoTurkeyUgandaUkraineUruguayUzbekistanVenezuelaVietnamWest IndiesWestern AfricaWestern AsiaWestern EuropeYemenZaireZimbabweAzores
Receiving Food Stamps
Income
Poverty
Unemployment
Labor Participation
Family Structure
Vehicle Availability
Education Level
Disability

Receiving Food Stamps Comparison

Samoans

Africans

Fair
Tragic
12.1%
RECEIVING FOOD STAMPS
31.0/ 100
METRIC RATING
192nd/ 347
METRIC RANK
15.1%
RECEIVING FOOD STAMPS
0.0/ 100
METRIC RATING
286th/ 347
METRIC RANK

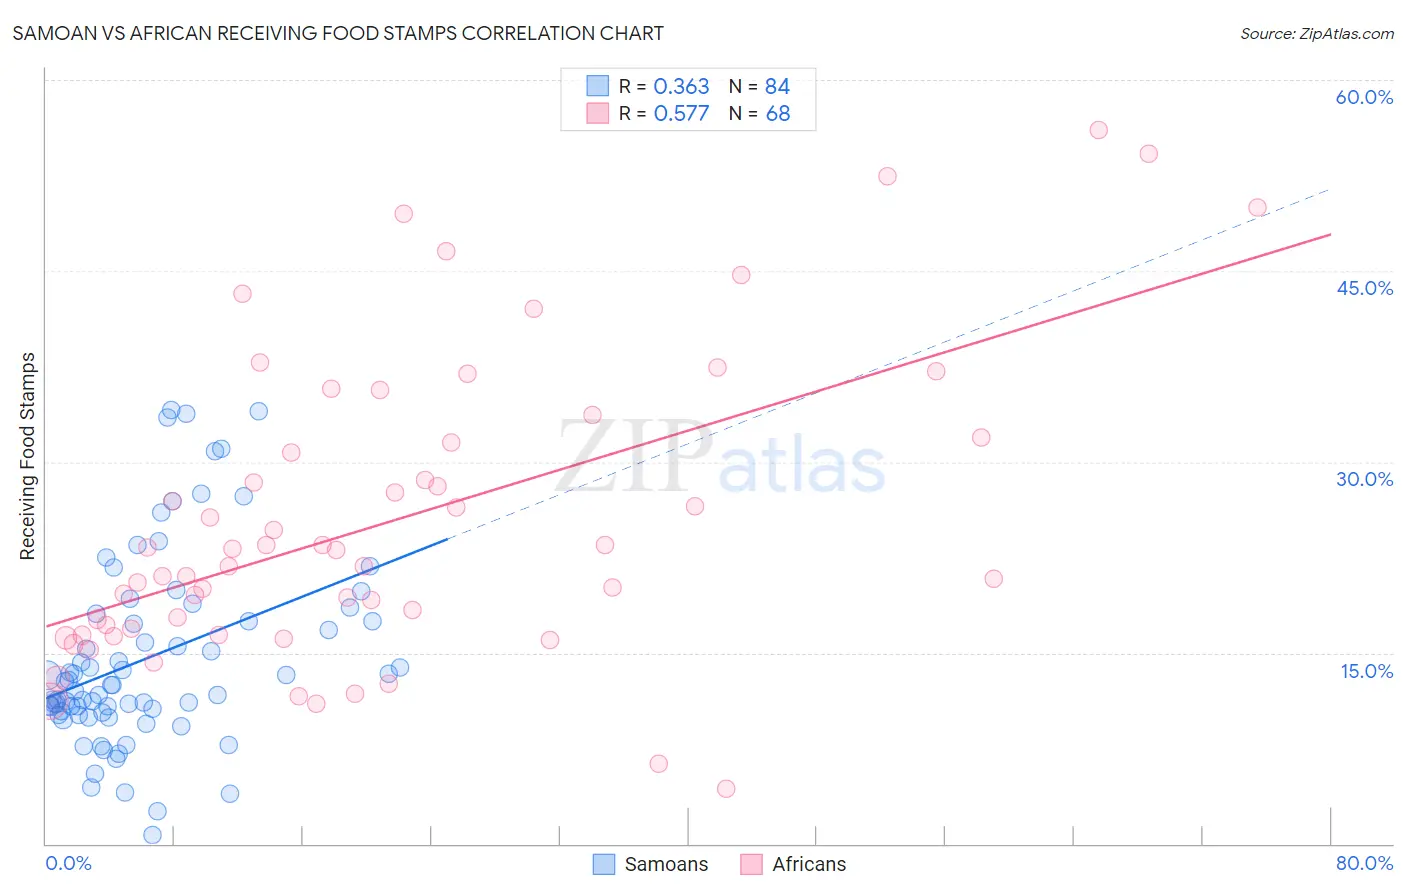
Samoan vs African Receiving Food Stamps Correlation Chart

The statistical analysis conducted on geographies consisting of 224,983,999 people shows a mild positive correlation between the proportion of Samoans and percentage of population receiving government assistance and/or food stamps in the United States with a correlation coefficient (R) of 0.363 and weighted average of 12.1%. Similarly, the statistical analysis conducted on geographies consisting of 468,859,101 people shows a substantial positive correlation between the proportion of Africans and percentage of population receiving government assistance and/or food stamps in the United States with a correlation coefficient (R) of 0.577 and weighted average of 15.1%, a difference of 25.3%.
Samoan vs African Receiving Food Stamps

Receiving Food Stamps Correlation Summary

MeasurementSamoanAfrican
Minimum0.70%4.3%
Maximum34.1%56.1%
Range33.4%51.8%
Mean14.6%25.4%
Median12.4%22.5%
Interquartile 25% (IQ1)10.4%16.6%
Interquartile 75% (IQ3)17.8%31.7%
Interquartile Range (IQR)7.4%15.1%
Standard Deviation (Sample)7.5%11.9%
Standard Deviation (Population)7.5%11.8%

Similar Demographics by Receiving Food Stamps

Demographics Similar to Samoans by Receiving Food Stamps

In terms of receiving food stamps, the demographic groups most similar to Samoans are Venezuelan (12.0%, a difference of 0.18%), Immigrants from Peru (12.0%, a difference of 0.19%), Immigrants from Cameroon (12.0%, a difference of 0.24%), Sudanese (12.0%, a difference of 0.38%), and Immigrants from Fiji (12.1%, a difference of 0.53%).
DemographicsRating | RankReceiving Food Stamps
Immigrants | Iraq
37.1
/100
|
#185
Fair
12.0%
Spanish
36.9
/100
|
#186
Fair
12.0%
Albanians
35.4
/100
|
#187
Fair
12.0%
Sudanese
33.4
/100
|
#188
Fair
12.0%
Immigrants | Cameroon
32.5
/100
|
#189
Fair
12.0%
Immigrants | Peru
32.2
/100
|
#190
Fair
12.0%
Venezuelans
32.1
/100
|
#191
Fair
12.0%
Samoans
31.0
/100
|
#192
Fair
12.1%
Immigrants | Fiji
27.8
/100
|
#193
Fair
12.1%
Immigrants | Sudan
27.1
/100
|
#194
Fair
12.1%
Americans
26.7
/100
|
#195
Fair
12.2%
Iraqis
26.6
/100
|
#196
Fair
12.2%
Delaware
26.1
/100
|
#197
Fair
12.2%
Immigrants | Costa Rica
25.4
/100
|
#198
Fair
12.2%
Portuguese
25.1
/100
|
#199
Fair
12.2%

Demographics Similar to Africans by Receiving Food Stamps

In terms of receiving food stamps, the demographic groups most similar to Africans are Immigrants from Liberia (15.1%, a difference of 0.14%), Immigrants from Mexico (15.2%, a difference of 0.23%), Immigrants from Ecuador (15.0%, a difference of 0.52%), Bangladeshi (15.0%, a difference of 0.53%), and Immigrants from Belize (15.2%, a difference of 0.69%).
DemographicsRating | RankReceiving Food Stamps
Kiowa
0.0
/100
|
#279
Tragic
14.9%
Ecuadorians
0.0
/100
|
#280
Tragic
14.9%
Spanish American Indians
0.0
/100
|
#281
Tragic
14.9%
Immigrants | Central America
0.0
/100
|
#282
Tragic
15.0%
Bangladeshis
0.0
/100
|
#283
Tragic
15.0%
Immigrants | Ecuador
0.0
/100
|
#284
Tragic
15.0%
Immigrants | Liberia
0.0
/100
|
#285
Tragic
15.1%
Africans
0.0
/100
|
#286
Tragic
15.1%
Immigrants | Mexico
0.0
/100
|
#287
Tragic
15.2%
Immigrants | Belize
0.0
/100
|
#288
Tragic
15.2%
Immigrants | Senegal
0.0
/100
|
#289
Tragic
15.3%
Senegalese
0.0
/100
|
#290
Tragic
15.4%
Hondurans
0.0
/100
|
#291
Tragic
15.5%
Alaska Natives
0.0
/100
|
#292
Tragic
15.6%
Vietnamese
0.0
/100
|
#293
Tragic
15.7%