Dutch West Indian vs African Receiving Food Stamps
COMPARE
Dutch West Indian
African
Receiving Food Stamps
Receiving Food Stamps Comparison
Dutch West Indians
Africans
14.3%
RECEIVING FOOD STAMPS
0.2/ 100
METRIC RATING
267th/ 347
METRIC RANK
15.1%
RECEIVING FOOD STAMPS
0.0/ 100
METRIC RATING
286th/ 347
METRIC RANK
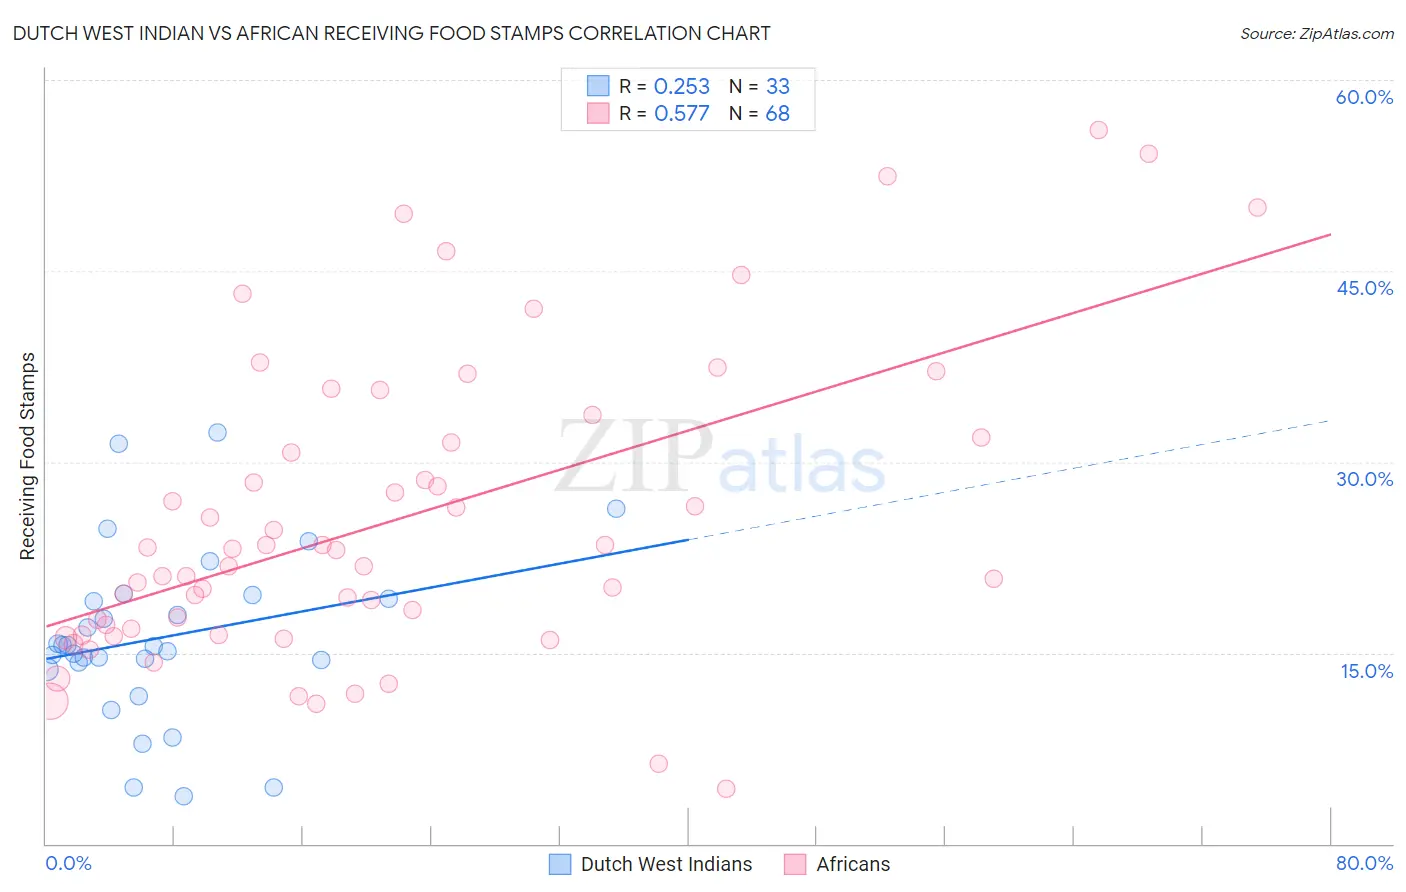
Dutch West Indian vs African Receiving Food Stamps Correlation Chart
The statistical analysis conducted on geographies consisting of 85,754,540 people shows a weak positive correlation between the proportion of Dutch West Indians and percentage of population receiving government assistance and/or food stamps in the United States with a correlation coefficient (R) of 0.253 and weighted average of 14.3%. Similarly, the statistical analysis conducted on geographies consisting of 468,859,101 people shows a substantial positive correlation between the proportion of Africans and percentage of population receiving government assistance and/or food stamps in the United States with a correlation coefficient (R) of 0.577 and weighted average of 15.1%, a difference of 5.6%.
Receiving Food Stamps Correlation Summary
| Measurement | Dutch West Indian | African |
| Minimum | 3.8% | 4.3% |
| Maximum | 32.3% | 56.1% |
| Range | 28.5% | 51.8% |
| Mean | 16.2% | 25.4% |
| Median | 15.5% | 22.5% |
| Interquartile 25% (IQ1) | 14.0% | 16.6% |
| Interquartile 75% (IQ3) | 19.4% | 31.7% |
| Interquartile Range (IQR) | 5.4% | 15.1% |
| Standard Deviation (Sample) | 6.7% | 11.9% |
| Standard Deviation (Population) | 6.6% | 11.8% |
Demographics Similar to Dutch West Indians and Africans by Receiving Food Stamps
In terms of receiving food stamps, the demographic groups most similar to Dutch West Indians are Cheyenne (14.3%, a difference of 0.22%), Guatemalan (14.4%, a difference of 0.66%), Nepalese (14.6%, a difference of 1.9%), Mexican (14.6%, a difference of 2.1%), and Immigrants from Guatemala (14.6%, a difference of 2.2%). Similarly, the demographic groups most similar to Africans are Immigrants from Liberia (15.1%, a difference of 0.14%), Immigrants from Ecuador (15.0%, a difference of 0.52%), Bangladeshi (15.0%, a difference of 0.53%), Immigrants from Central America (15.0%, a difference of 0.81%), and Spanish American Indian (14.9%, a difference of 1.3%).
| Demographics | Rating | Rank | Receiving Food Stamps |
| Cheyenne | 0.2 /100 | #266 | Tragic 14.3% |
| Dutch West Indians | 0.2 /100 | #267 | Tragic 14.3% |
| Guatemalans | 0.1 /100 | #268 | Tragic 14.4% |
| Nepalese | 0.1 /100 | #269 | Tragic 14.6% |
| Mexicans | 0.1 /100 | #270 | Tragic 14.6% |
| Immigrants | Guatemala | 0.1 /100 | #271 | Tragic 14.6% |
| Chippewa | 0.1 /100 | #272 | Tragic 14.7% |
| Alaskan Athabascans | 0.1 /100 | #273 | Tragic 14.7% |
| Immigrants | Western Africa | 0.1 /100 | #274 | Tragic 14.7% |
| Ute | 0.1 /100 | #275 | Tragic 14.7% |
| Liberians | 0.1 /100 | #276 | Tragic 14.8% |
| Seminole | 0.1 /100 | #277 | Tragic 14.8% |
| Belizeans | 0.1 /100 | #278 | Tragic 14.8% |
| Kiowa | 0.0 /100 | #279 | Tragic 14.9% |
| Ecuadorians | 0.0 /100 | #280 | Tragic 14.9% |
| Spanish American Indians | 0.0 /100 | #281 | Tragic 14.9% |
| Immigrants | Central America | 0.0 /100 | #282 | Tragic 15.0% |
| Bangladeshis | 0.0 /100 | #283 | Tragic 15.0% |
| Immigrants | Ecuador | 0.0 /100 | #284 | Tragic 15.0% |
| Immigrants | Liberia | 0.0 /100 | #285 | Tragic 15.1% |
| Africans | 0.0 /100 | #286 | Tragic 15.1% |