Samoan vs Ghanaian Receiving Food Stamps
COMPARE
Samoan
Ghanaian
Receiving Food Stamps
Receiving Food Stamps Comparison
Samoans
Ghanaians
12.1%
RECEIVING FOOD STAMPS
31.0/ 100
METRIC RATING
192nd/ 347
METRIC RANK
14.0%
RECEIVING FOOD STAMPS
0.5/ 100
METRIC RATING
252nd/ 347
METRIC RANK
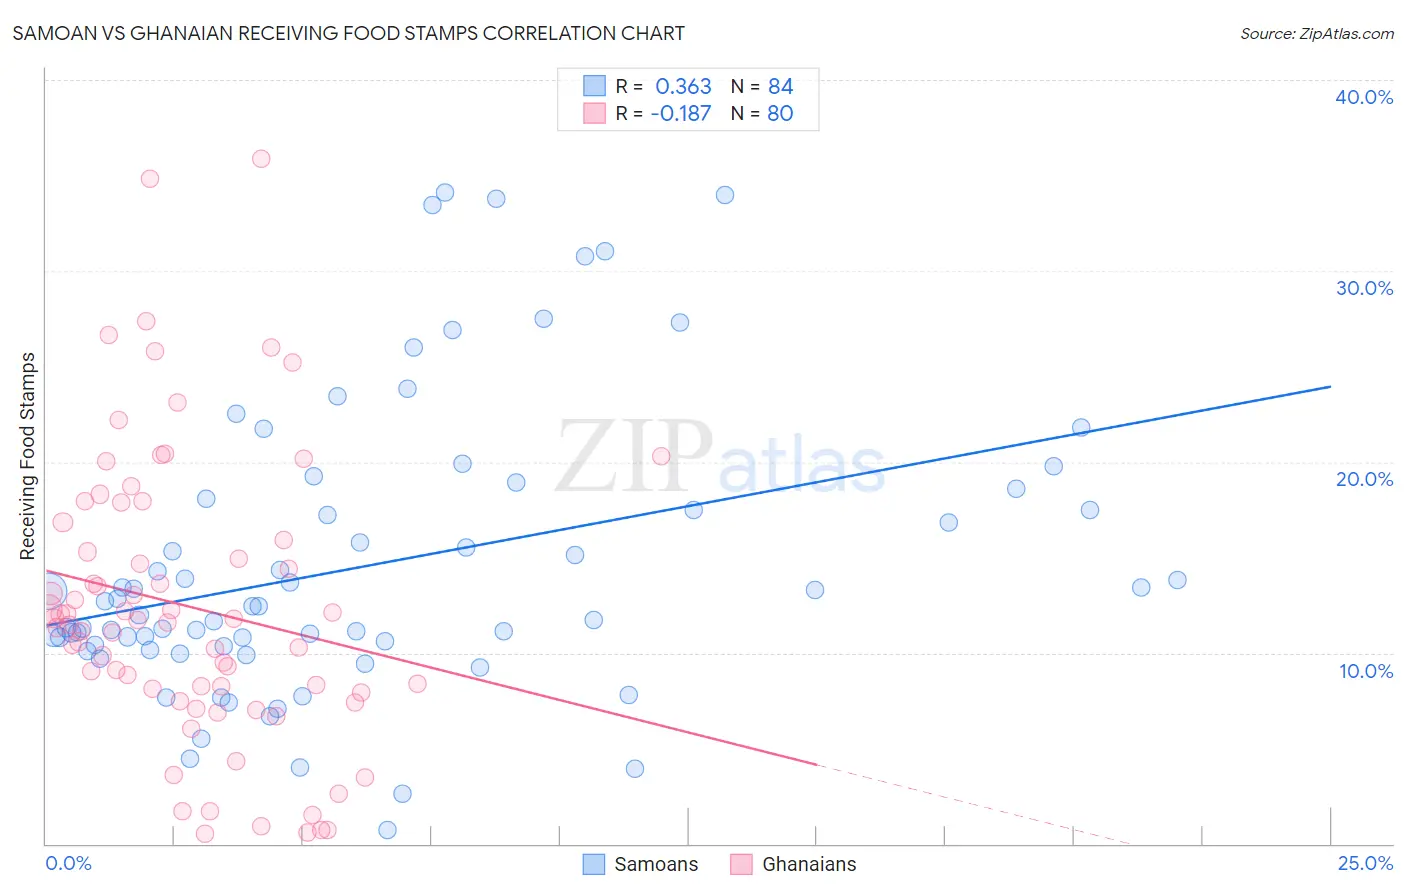
Samoan vs Ghanaian Receiving Food Stamps Correlation Chart
The statistical analysis conducted on geographies consisting of 224,983,999 people shows a mild positive correlation between the proportion of Samoans and percentage of population receiving government assistance and/or food stamps in the United States with a correlation coefficient (R) of 0.363 and weighted average of 12.1%. Similarly, the statistical analysis conducted on geographies consisting of 190,218,153 people shows a poor negative correlation between the proportion of Ghanaians and percentage of population receiving government assistance and/or food stamps in the United States with a correlation coefficient (R) of -0.187 and weighted average of 14.0%, a difference of 15.6%.
Receiving Food Stamps Correlation Summary
| Measurement | Samoan | Ghanaian |
| Minimum | 0.70% | 0.50% |
| Maximum | 34.1% | 35.9% |
| Range | 33.4% | 35.4% |
| Mean | 14.6% | 12.4% |
| Median | 12.4% | 11.6% |
| Interquartile 25% (IQ1) | 10.4% | 8.0% |
| Interquartile 75% (IQ3) | 17.8% | 16.4% |
| Interquartile Range (IQR) | 7.4% | 8.3% |
| Standard Deviation (Sample) | 7.5% | 7.6% |
| Standard Deviation (Population) | 7.5% | 7.5% |
Similar Demographics by Receiving Food Stamps
Demographics Similar to Samoans by Receiving Food Stamps
In terms of receiving food stamps, the demographic groups most similar to Samoans are Venezuelan (12.0%, a difference of 0.18%), Immigrants from Peru (12.0%, a difference of 0.19%), Immigrants from Cameroon (12.0%, a difference of 0.24%), Sudanese (12.0%, a difference of 0.38%), and Immigrants from Fiji (12.1%, a difference of 0.53%).
| Demographics | Rating | Rank | Receiving Food Stamps |
| Immigrants | Iraq | 37.1 /100 | #185 | Fair 12.0% |
| Spanish | 36.9 /100 | #186 | Fair 12.0% |
| Albanians | 35.4 /100 | #187 | Fair 12.0% |
| Sudanese | 33.4 /100 | #188 | Fair 12.0% |
| Immigrants | Cameroon | 32.5 /100 | #189 | Fair 12.0% |
| Immigrants | Peru | 32.2 /100 | #190 | Fair 12.0% |
| Venezuelans | 32.1 /100 | #191 | Fair 12.0% |
| Samoans | 31.0 /100 | #192 | Fair 12.1% |
| Immigrants | Fiji | 27.8 /100 | #193 | Fair 12.1% |
| Immigrants | Sudan | 27.1 /100 | #194 | Fair 12.1% |
| Americans | 26.7 /100 | #195 | Fair 12.2% |
| Iraqis | 26.6 /100 | #196 | Fair 12.2% |
| Delaware | 26.1 /100 | #197 | Fair 12.2% |
| Immigrants | Costa Rica | 25.4 /100 | #198 | Fair 12.2% |
| Portuguese | 25.1 /100 | #199 | Fair 12.2% |
Demographics Similar to Ghanaians by Receiving Food Stamps
In terms of receiving food stamps, the demographic groups most similar to Ghanaians are Spanish American (14.0%, a difference of 0.37%), Yaqui (13.9%, a difference of 0.44%), Immigrants from Cambodia (13.9%, a difference of 0.52%), Indonesian (13.9%, a difference of 0.69%), and Marshallese (14.1%, a difference of 0.97%).
| Demographics | Rating | Rank | Receiving Food Stamps |
| Immigrants | Somalia | 0.9 /100 | #245 | Tragic 13.7% |
| Cree | 0.8 /100 | #246 | Tragic 13.7% |
| Mexican American Indians | 0.7 /100 | #247 | Tragic 13.8% |
| Immigrants | Laos | 0.7 /100 | #248 | Tragic 13.8% |
| Indonesians | 0.6 /100 | #249 | Tragic 13.9% |
| Immigrants | Cambodia | 0.5 /100 | #250 | Tragic 13.9% |
| Yaqui | 0.5 /100 | #251 | Tragic 13.9% |
| Ghanaians | 0.5 /100 | #252 | Tragic 14.0% |
| Spanish Americans | 0.4 /100 | #253 | Tragic 14.0% |
| Marshallese | 0.3 /100 | #254 | Tragic 14.1% |
| Sub-Saharan Africans | 0.3 /100 | #255 | Tragic 14.1% |
| Japanese | 0.3 /100 | #256 | Tragic 14.1% |
| Arapaho | 0.3 /100 | #257 | Tragic 14.1% |
| Immigrants | Ghana | 0.3 /100 | #258 | Tragic 14.1% |
| Creek | 0.3 /100 | #259 | Tragic 14.1% |