Salvadoran vs Immigrants from Bangladesh Male Poverty
COMPARE
Salvadoran
Immigrants from Bangladesh
Male Poverty
Male Poverty Comparison
Salvadorans
Immigrants from Bangladesh
12.6%
MALE POVERTY
0.6/ 100
METRIC RATING
231st/ 347
METRIC RANK
14.1%
MALE POVERTY
0.0/ 100
METRIC RATING
305th/ 347
METRIC RANK
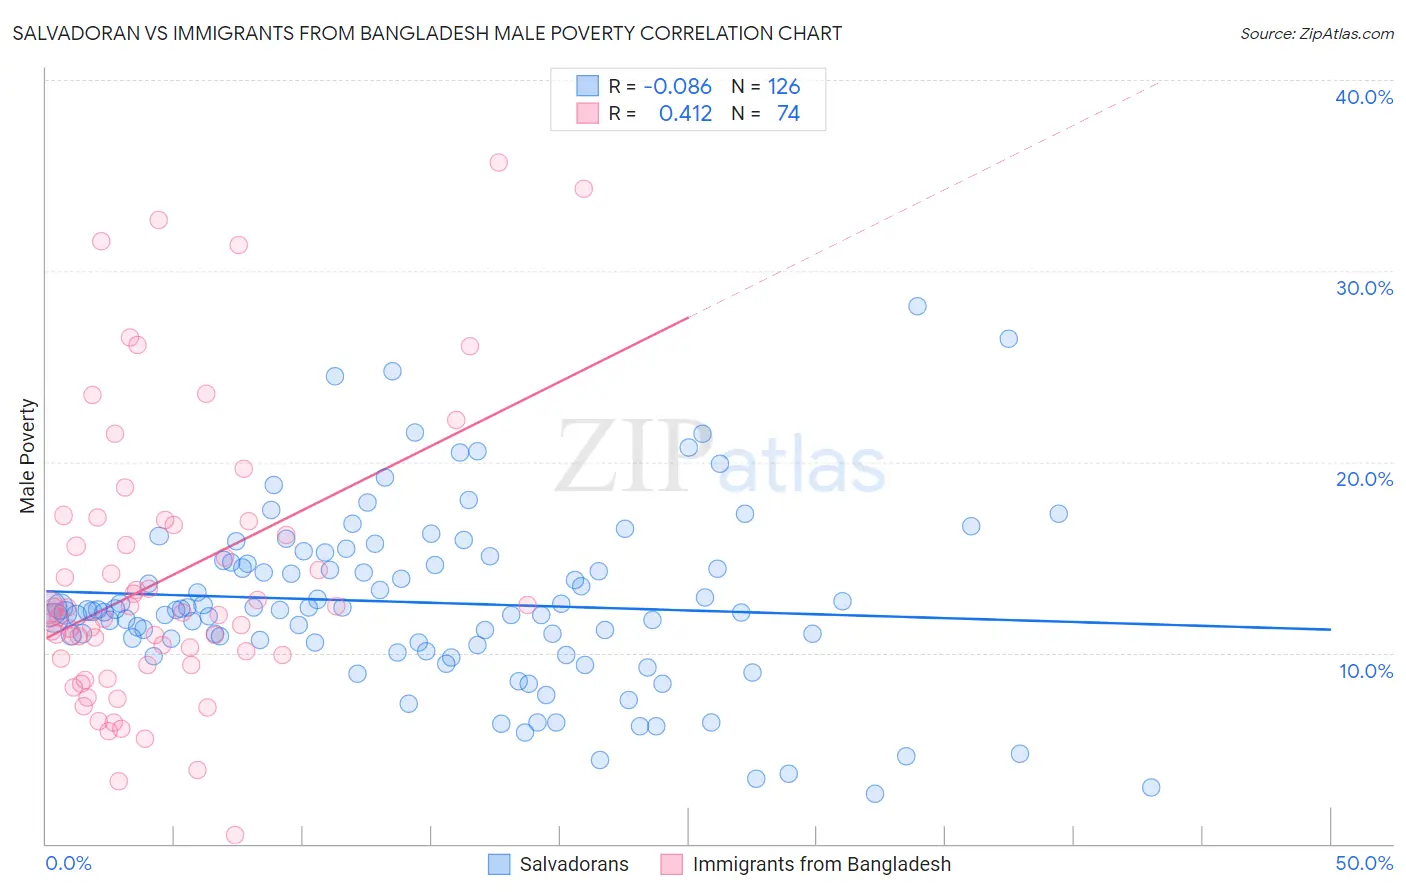
Salvadoran vs Immigrants from Bangladesh Male Poverty Correlation Chart
The statistical analysis conducted on geographies consisting of 398,602,565 people shows a slight negative correlation between the proportion of Salvadorans and poverty level among males in the United States with a correlation coefficient (R) of -0.086 and weighted average of 12.6%. Similarly, the statistical analysis conducted on geographies consisting of 203,544,271 people shows a moderate positive correlation between the proportion of Immigrants from Bangladesh and poverty level among males in the United States with a correlation coefficient (R) of 0.412 and weighted average of 14.1%, a difference of 12.2%.
Male Poverty Correlation Summary
| Measurement | Salvadoran | Immigrants from Bangladesh |
| Minimum | 2.6% | 0.44% |
| Maximum | 28.2% | 35.7% |
| Range | 25.5% | 35.2% |
| Mean | 12.6% | 13.9% |
| Median | 12.2% | 12.1% |
| Interquartile 25% (IQ1) | 10.5% | 9.7% |
| Interquartile 75% (IQ3) | 14.7% | 16.7% |
| Interquartile Range (IQR) | 4.2% | 7.0% |
| Standard Deviation (Sample) | 4.6% | 7.4% |
| Standard Deviation (Population) | 4.6% | 7.3% |
Similar Demographics by Male Poverty
Demographics Similar to Salvadorans by Male Poverty
In terms of male poverty, the demographic groups most similar to Salvadorans are Nicaraguan (12.6%, a difference of 0.12%), Fijian (12.6%, a difference of 0.16%), Immigrants from Armenia (12.6%, a difference of 0.23%), Marshallese (12.5%, a difference of 0.56%), and Immigrants from Laos (12.6%, a difference of 0.59%).
| Demographics | Rating | Rank | Male Poverty |
| Immigrants | Nigeria | 1.6 /100 | #224 | Tragic 12.3% |
| Osage | 1.5 /100 | #225 | Tragic 12.3% |
| Nigerians | 1.4 /100 | #226 | Tragic 12.3% |
| Alaska Natives | 1.4 /100 | #227 | Tragic 12.4% |
| Alsatians | 1.3 /100 | #228 | Tragic 12.4% |
| Cubans | 1.3 /100 | #229 | Tragic 12.4% |
| Marshallese | 0.8 /100 | #230 | Tragic 12.5% |
| Salvadorans | 0.6 /100 | #231 | Tragic 12.6% |
| Nicaraguans | 0.6 /100 | #232 | Tragic 12.6% |
| Fijians | 0.6 /100 | #233 | Tragic 12.6% |
| Immigrants | Armenia | 0.6 /100 | #234 | Tragic 12.6% |
| Immigrants | Laos | 0.5 /100 | #235 | Tragic 12.6% |
| Immigrants | Saudi Arabia | 0.4 /100 | #236 | Tragic 12.7% |
| French American Indians | 0.4 /100 | #237 | Tragic 12.7% |
| Ecuadorians | 0.4 /100 | #238 | Tragic 12.7% |
Demographics Similar to Immigrants from Bangladesh by Male Poverty
In terms of male poverty, the demographic groups most similar to Immigrants from Bangladesh are Creek (14.1%, a difference of 0.070%), Senegalese (14.1%, a difference of 0.21%), Bahamian (14.1%, a difference of 0.32%), Immigrants from Caribbean (14.0%, a difference of 0.36%), and Immigrants from Senegal (14.0%, a difference of 0.42%).
| Demographics | Rating | Rank | Male Poverty |
| Blackfeet | 0.0 /100 | #298 | Tragic 14.0% |
| Immigrants | Guatemala | 0.0 /100 | #299 | Tragic 14.0% |
| Immigrants | Mexico | 0.0 /100 | #300 | Tragic 14.0% |
| Immigrants | Senegal | 0.0 /100 | #301 | Tragic 14.0% |
| Immigrants | Caribbean | 0.0 /100 | #302 | Tragic 14.0% |
| Bahamians | 0.0 /100 | #303 | Tragic 14.1% |
| Senegalese | 0.0 /100 | #304 | Tragic 14.1% |
| Immigrants | Bangladesh | 0.0 /100 | #305 | Tragic 14.1% |
| Creek | 0.0 /100 | #306 | Tragic 14.1% |
| Dutch West Indians | 0.0 /100 | #307 | Tragic 14.2% |
| Africans | 0.0 /100 | #308 | Tragic 14.2% |
| Somalis | 0.0 /100 | #309 | Tragic 14.3% |
| Seminole | 0.0 /100 | #310 | Tragic 14.3% |
| Hondurans | 0.0 /100 | #311 | Tragic 14.3% |
| Choctaw | 0.0 /100 | #312 | Tragic 14.4% |