English vs Immigrants from Bangladesh Male Poverty
COMPARE
English
Immigrants from Bangladesh
Male Poverty
Male Poverty Comparison
English
Immigrants from Bangladesh
10.3%
MALE POVERTY
96.4/ 100
METRIC RATING
80th/ 347
METRIC RANK
14.1%
MALE POVERTY
0.0/ 100
METRIC RATING
305th/ 347
METRIC RANK
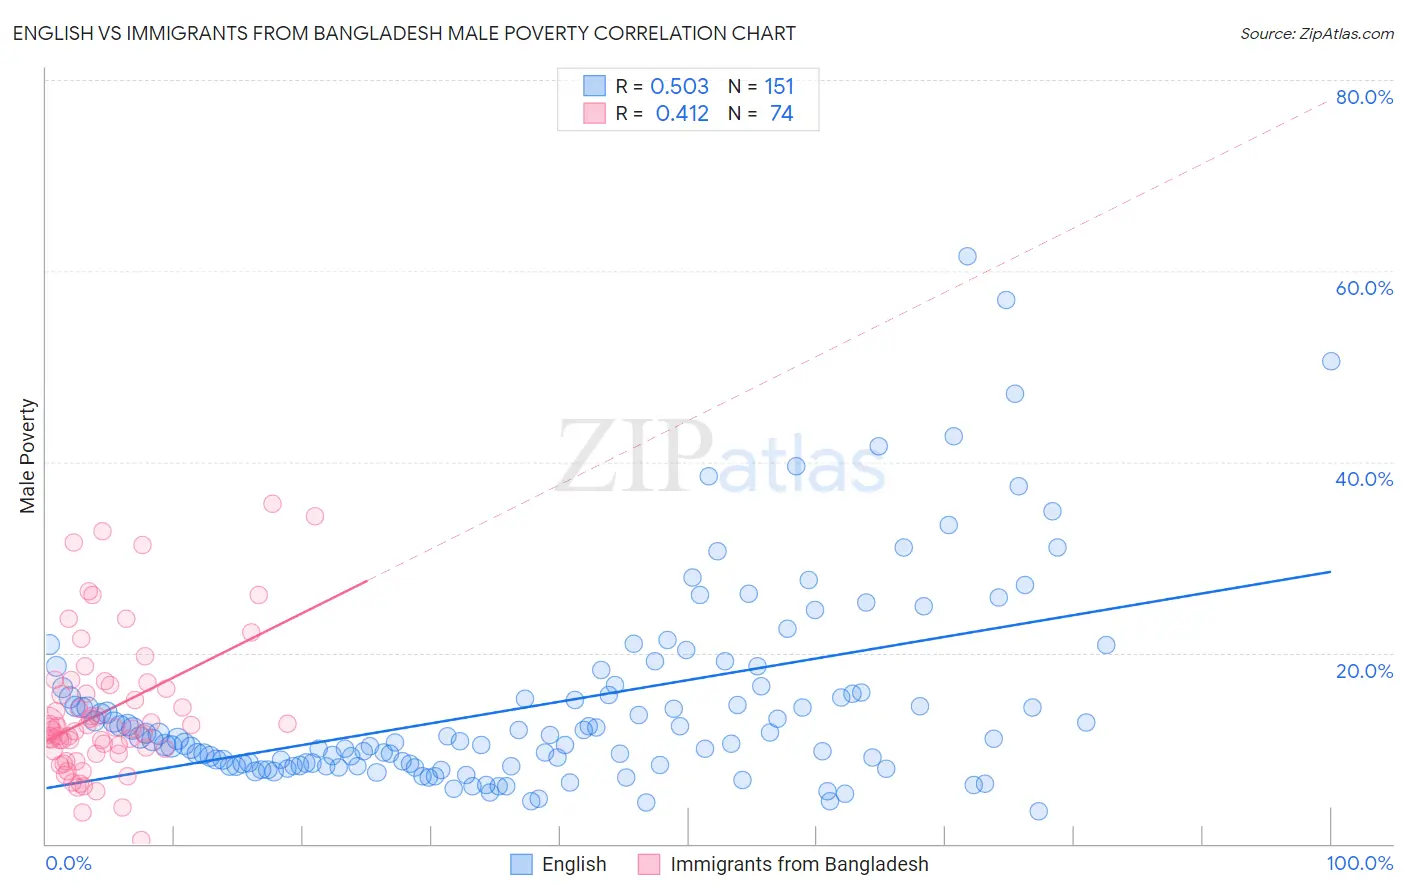
English vs Immigrants from Bangladesh Male Poverty Correlation Chart
The statistical analysis conducted on geographies consisting of 577,651,479 people shows a substantial positive correlation between the proportion of English and poverty level among males in the United States with a correlation coefficient (R) of 0.503 and weighted average of 10.3%. Similarly, the statistical analysis conducted on geographies consisting of 203,544,271 people shows a moderate positive correlation between the proportion of Immigrants from Bangladesh and poverty level among males in the United States with a correlation coefficient (R) of 0.412 and weighted average of 14.1%, a difference of 37.1%.
Male Poverty Correlation Summary
| Measurement | English | Immigrants from Bangladesh |
| Minimum | 3.5% | 0.44% |
| Maximum | 61.6% | 35.7% |
| Range | 58.1% | 35.2% |
| Mean | 14.6% | 13.9% |
| Median | 10.9% | 12.1% |
| Interquartile 25% (IQ1) | 8.2% | 9.7% |
| Interquartile 75% (IQ3) | 15.8% | 16.7% |
| Interquartile Range (IQR) | 7.7% | 7.0% |
| Standard Deviation (Sample) | 10.4% | 7.4% |
| Standard Deviation (Population) | 10.4% | 7.3% |
Similar Demographics by Male Poverty
Demographics Similar to English by Male Poverty
In terms of male poverty, the demographic groups most similar to English are Immigrants from North America (10.3%, a difference of 0.080%), Irish (10.3%, a difference of 0.32%), Immigrants from Belgium (10.3%, a difference of 0.34%), Dutch (10.2%, a difference of 0.37%), and Immigrants from Eastern Europe (10.2%, a difference of 0.38%).
| Demographics | Rating | Rank | Male Poverty |
| Immigrants | Asia | 97.0 /100 | #73 | Exceptional 10.2% |
| Immigrants | Eastern Europe | 96.9 /100 | #74 | Exceptional 10.2% |
| Carpatho Rusyns | 96.9 /100 | #75 | Exceptional 10.2% |
| Dutch | 96.9 /100 | #76 | Exceptional 10.2% |
| Immigrants | Belgium | 96.8 /100 | #77 | Exceptional 10.3% |
| Irish | 96.8 /100 | #78 | Exceptional 10.3% |
| Immigrants | North America | 96.5 /100 | #79 | Exceptional 10.3% |
| English | 96.4 /100 | #80 | Exceptional 10.3% |
| Belgians | 95.9 /100 | #81 | Exceptional 10.3% |
| Egyptians | 95.9 /100 | #82 | Exceptional 10.3% |
| Immigrants | Sweden | 95.7 /100 | #83 | Exceptional 10.3% |
| Czechoslovakians | 95.6 /100 | #84 | Exceptional 10.3% |
| Immigrants | England | 95.5 /100 | #85 | Exceptional 10.4% |
| Immigrants | Eastern Asia | 95.3 /100 | #86 | Exceptional 10.4% |
| Northern Europeans | 95.2 /100 | #87 | Exceptional 10.4% |
Demographics Similar to Immigrants from Bangladesh by Male Poverty
In terms of male poverty, the demographic groups most similar to Immigrants from Bangladesh are Creek (14.1%, a difference of 0.070%), Senegalese (14.1%, a difference of 0.21%), Bahamian (14.1%, a difference of 0.32%), Immigrants from Caribbean (14.0%, a difference of 0.36%), and Immigrants from Senegal (14.0%, a difference of 0.42%).
| Demographics | Rating | Rank | Male Poverty |
| Blackfeet | 0.0 /100 | #298 | Tragic 14.0% |
| Immigrants | Guatemala | 0.0 /100 | #299 | Tragic 14.0% |
| Immigrants | Mexico | 0.0 /100 | #300 | Tragic 14.0% |
| Immigrants | Senegal | 0.0 /100 | #301 | Tragic 14.0% |
| Immigrants | Caribbean | 0.0 /100 | #302 | Tragic 14.0% |
| Bahamians | 0.0 /100 | #303 | Tragic 14.1% |
| Senegalese | 0.0 /100 | #304 | Tragic 14.1% |
| Immigrants | Bangladesh | 0.0 /100 | #305 | Tragic 14.1% |
| Creek | 0.0 /100 | #306 | Tragic 14.1% |
| Dutch West Indians | 0.0 /100 | #307 | Tragic 14.2% |
| Africans | 0.0 /100 | #308 | Tragic 14.2% |
| Somalis | 0.0 /100 | #309 | Tragic 14.3% |
| Seminole | 0.0 /100 | #310 | Tragic 14.3% |
| Hondurans | 0.0 /100 | #311 | Tragic 14.3% |
| Choctaw | 0.0 /100 | #312 | Tragic 14.4% |