Salvadoran vs Cajun Male Poverty
COMPARE
Salvadoran
Cajun
Male Poverty
Male Poverty Comparison
Salvadorans
Cajuns
12.6%
MALE POVERTY
0.6/ 100
METRIC RATING
231st/ 347
METRIC RANK
13.9%
MALE POVERTY
0.0/ 100
METRIC RATING
296th/ 347
METRIC RANK
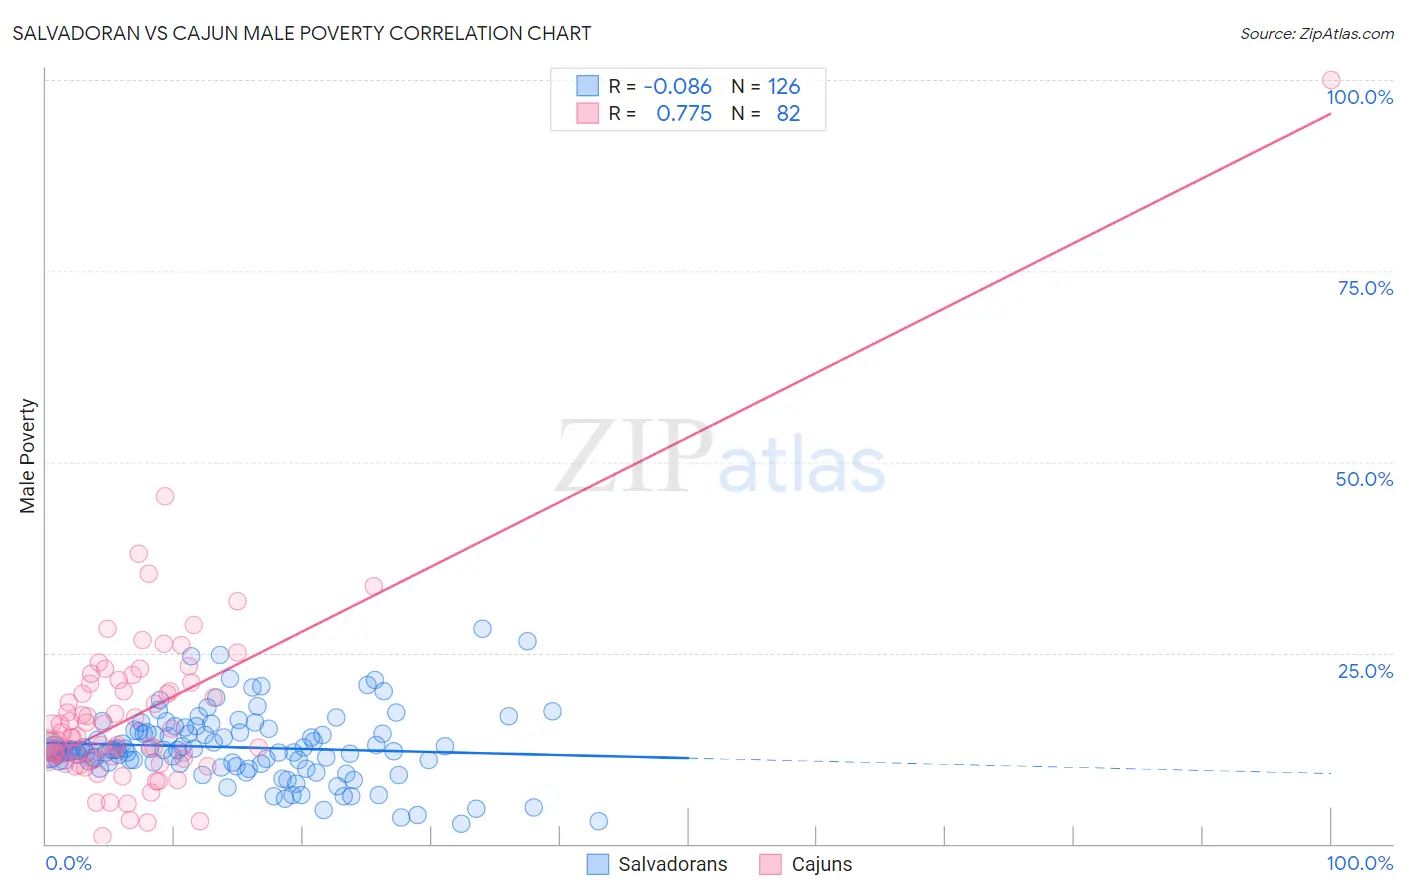
Salvadoran vs Cajun Male Poverty Correlation Chart
The statistical analysis conducted on geographies consisting of 398,602,565 people shows a slight negative correlation between the proportion of Salvadorans and poverty level among males in the United States with a correlation coefficient (R) of -0.086 and weighted average of 12.6%. Similarly, the statistical analysis conducted on geographies consisting of 149,683,084 people shows a strong positive correlation between the proportion of Cajuns and poverty level among males in the United States with a correlation coefficient (R) of 0.775 and weighted average of 13.9%, a difference of 10.7%.
Male Poverty Correlation Summary
| Measurement | Salvadoran | Cajun |
| Minimum | 2.6% | 0.97% |
| Maximum | 28.2% | 100.0% |
| Range | 25.5% | 99.0% |
| Mean | 12.6% | 17.0% |
| Median | 12.2% | 13.9% |
| Interquartile 25% (IQ1) | 10.5% | 10.9% |
| Interquartile 75% (IQ3) | 14.7% | 20.9% |
| Interquartile Range (IQR) | 4.2% | 10.0% |
| Standard Deviation (Sample) | 4.6% | 12.4% |
| Standard Deviation (Population) | 4.6% | 12.3% |
Similar Demographics by Male Poverty
Demographics Similar to Salvadorans by Male Poverty
In terms of male poverty, the demographic groups most similar to Salvadorans are Nicaraguan (12.6%, a difference of 0.12%), Fijian (12.6%, a difference of 0.16%), Immigrants from Armenia (12.6%, a difference of 0.23%), Marshallese (12.5%, a difference of 0.56%), and Immigrants from Laos (12.6%, a difference of 0.59%).
| Demographics | Rating | Rank | Male Poverty |
| Immigrants | Nigeria | 1.6 /100 | #224 | Tragic 12.3% |
| Osage | 1.5 /100 | #225 | Tragic 12.3% |
| Nigerians | 1.4 /100 | #226 | Tragic 12.3% |
| Alaska Natives | 1.4 /100 | #227 | Tragic 12.4% |
| Alsatians | 1.3 /100 | #228 | Tragic 12.4% |
| Cubans | 1.3 /100 | #229 | Tragic 12.4% |
| Marshallese | 0.8 /100 | #230 | Tragic 12.5% |
| Salvadorans | 0.6 /100 | #231 | Tragic 12.6% |
| Nicaraguans | 0.6 /100 | #232 | Tragic 12.6% |
| Fijians | 0.6 /100 | #233 | Tragic 12.6% |
| Immigrants | Armenia | 0.6 /100 | #234 | Tragic 12.6% |
| Immigrants | Laos | 0.5 /100 | #235 | Tragic 12.6% |
| Immigrants | Saudi Arabia | 0.4 /100 | #236 | Tragic 12.7% |
| French American Indians | 0.4 /100 | #237 | Tragic 12.7% |
| Ecuadorians | 0.4 /100 | #238 | Tragic 12.7% |
Demographics Similar to Cajuns by Male Poverty
In terms of male poverty, the demographic groups most similar to Cajuns are Immigrants from Central America (13.9%, a difference of 0.11%), Hispanic or Latino (13.9%, a difference of 0.40%), Immigrants from Belize (13.8%, a difference of 0.45%), Indonesian (13.8%, a difference of 0.46%), and Vietnamese (13.8%, a difference of 0.63%).
| Demographics | Rating | Rank | Male Poverty |
| Guatemalans | 0.0 /100 | #289 | Tragic 13.8% |
| Immigrants | Zaire | 0.0 /100 | #290 | Tragic 13.8% |
| Vietnamese | 0.0 /100 | #291 | Tragic 13.8% |
| Indonesians | 0.0 /100 | #292 | Tragic 13.8% |
| Immigrants | Belize | 0.0 /100 | #293 | Tragic 13.8% |
| Hispanics or Latinos | 0.0 /100 | #294 | Tragic 13.9% |
| Immigrants | Central America | 0.0 /100 | #295 | Tragic 13.9% |
| Cajuns | 0.0 /100 | #296 | Tragic 13.9% |
| Inupiat | 0.0 /100 | #297 | Tragic 14.0% |
| Blackfeet | 0.0 /100 | #298 | Tragic 14.0% |
| Immigrants | Guatemala | 0.0 /100 | #299 | Tragic 14.0% |
| Immigrants | Mexico | 0.0 /100 | #300 | Tragic 14.0% |
| Immigrants | Senegal | 0.0 /100 | #301 | Tragic 14.0% |
| Immigrants | Caribbean | 0.0 /100 | #302 | Tragic 14.0% |
| Bahamians | 0.0 /100 | #303 | Tragic 14.1% |