Romanian vs Scottish Single Mother Poverty
COMPARE
Romanian
Scottish
Single Mother Poverty
Single Mother Poverty Comparison
Romanians
Scottish
27.8%
SINGLE MOTHER POVERTY
97.8/ 100
METRIC RATING
93rd/ 347
METRIC RANK
30.1%
SINGLE MOTHER POVERTY
6.0/ 100
METRIC RATING
226th/ 347
METRIC RANK
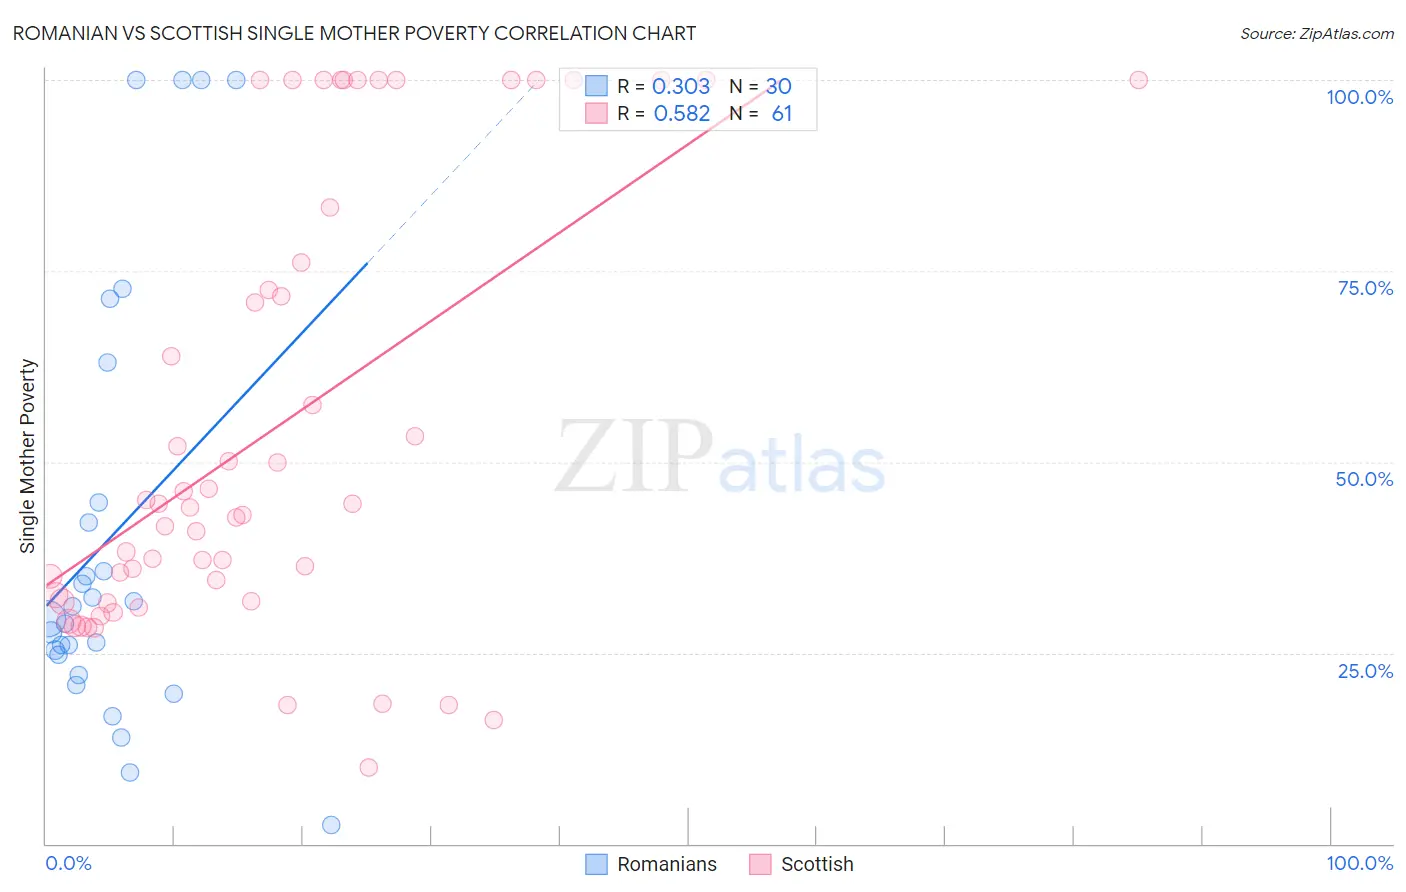
Romanian vs Scottish Single Mother Poverty Correlation Chart
The statistical analysis conducted on geographies consisting of 367,510,657 people shows a mild positive correlation between the proportion of Romanians and poverty level among single mothers in the United States with a correlation coefficient (R) of 0.303 and weighted average of 27.8%. Similarly, the statistical analysis conducted on geographies consisting of 539,065,597 people shows a substantial positive correlation between the proportion of Scottish and poverty level among single mothers in the United States with a correlation coefficient (R) of 0.582 and weighted average of 30.1%, a difference of 8.2%.
Single Mother Poverty Correlation Summary
| Measurement | Romanian | Scottish |
| Minimum | 2.5% | 10.0% |
| Maximum | 100.0% | 100.0% |
| Range | 97.5% | 90.0% |
| Mean | 40.4% | 54.2% |
| Median | 30.2% | 44.1% |
| Interquartile 25% (IQ1) | 24.8% | 31.8% |
| Interquartile 75% (IQ3) | 44.7% | 79.8% |
| Interquartile Range (IQR) | 19.9% | 48.0% |
| Standard Deviation (Sample) | 28.4% | 28.9% |
| Standard Deviation (Population) | 27.9% | 28.6% |
Similar Demographics by Single Mother Poverty
Demographics Similar to Romanians by Single Mother Poverty
In terms of single mother poverty, the demographic groups most similar to Romanians are Estonian (27.8%, a difference of 0.10%), Albanian (27.9%, a difference of 0.10%), Immigrants from Albania (27.8%, a difference of 0.12%), Chilean (27.9%, a difference of 0.13%), and Immigrants from Iraq (27.9%, a difference of 0.23%).
| Demographics | Rating | Rank | Single Mother Poverty |
| Immigrants | Ukraine | 98.6 /100 | #86 | Exceptional 27.7% |
| Afghans | 98.5 /100 | #87 | Exceptional 27.7% |
| Ethiopians | 98.4 /100 | #88 | Exceptional 27.7% |
| Immigrants | Ethiopia | 98.4 /100 | #89 | Exceptional 27.7% |
| Immigrants | France | 98.2 /100 | #90 | Exceptional 27.8% |
| Immigrants | Albania | 98.0 /100 | #91 | Exceptional 27.8% |
| Estonians | 97.9 /100 | #92 | Exceptional 27.8% |
| Romanians | 97.8 /100 | #93 | Exceptional 27.8% |
| Albanians | 97.6 /100 | #94 | Exceptional 27.9% |
| Chileans | 97.5 /100 | #95 | Exceptional 27.9% |
| Immigrants | Iraq | 97.3 /100 | #96 | Exceptional 27.9% |
| Immigrants | Brazil | 97.2 /100 | #97 | Exceptional 27.9% |
| Immigrants | Nepal | 97.2 /100 | #98 | Exceptional 27.9% |
| Immigrants | Netherlands | 97.2 /100 | #99 | Exceptional 27.9% |
| Zimbabweans | 97.1 /100 | #100 | Exceptional 27.9% |
Demographics Similar to Scottish by Single Mother Poverty
In terms of single mother poverty, the demographic groups most similar to Scottish are Immigrants from Liberia (30.1%, a difference of 0.030%), Spanish (30.1%, a difference of 0.060%), Immigrants from Sudan (30.1%, a difference of 0.090%), Spaniard (30.2%, a difference of 0.14%), and Immigrants from Cuba (30.1%, a difference of 0.16%).
| Demographics | Rating | Rank | Single Mother Poverty |
| Finns | 9.3 /100 | #219 | Tragic 30.0% |
| Germans | 8.8 /100 | #220 | Tragic 30.0% |
| Immigrants | Eritrea | 7.7 /100 | #221 | Tragic 30.0% |
| Sudanese | 7.6 /100 | #222 | Tragic 30.0% |
| Immigrants | Cuba | 6.9 /100 | #223 | Tragic 30.1% |
| Immigrants | Sudan | 6.5 /100 | #224 | Tragic 30.1% |
| Spanish | 6.3 /100 | #225 | Tragic 30.1% |
| Scottish | 6.0 /100 | #226 | Tragic 30.1% |
| Immigrants | Liberia | 5.9 /100 | #227 | Tragic 30.1% |
| Spaniards | 5.4 /100 | #228 | Tragic 30.2% |
| Immigrants | Barbados | 5.0 /100 | #229 | Tragic 30.2% |
| English | 4.8 /100 | #230 | Tragic 30.2% |
| Dutch | 4.3 /100 | #231 | Tragic 30.2% |
| Alaskan Athabascans | 4.1 /100 | #232 | Tragic 30.3% |
| Immigrants | Middle Africa | 3.5 /100 | #233 | Tragic 30.3% |