Romanian vs Immigrants from Zaire Single Mother Poverty

COMPARE

Romanian
Race
Ancestry
AfghanAfricanAlaska NativeAlaskan AthabascanAlbanianAleutAlsatianAmericanApacheArabArapahoArgentineanArmenianAssyrian/Chaldean/SyriacAustralianAustrianBahamianBangladeshiBarbadianBasqueBelgianBelizeanBermudanBhutaneseBlackfeetBolivianBrazilianBritishBritish West IndianBulgarianBurmeseCajunCambodianCanadianCape VerdeanCarpatho RusynCelticCentral AmericanCentral American IndianCherokeeCheyenneChickasawChileanChineseChippewaChoctawColombianColvilleComancheCosta RicanCreeCreekCroatianCrowCubanCypriotCzechCzechoslovakianDanishDelawareDominicanDutchDutch West IndianEastern EuropeanEcuadorianEgyptianEnglishEstonianEthiopianEuropeanFijianFilipinoFinnishFrenchFrench American IndianFrench CanadianGermanGerman RussianGhanaianGreekGuamanian/ChamorroGuatemalanGuyaneseHaitianHmongHonduranHopiHoumaHungarianIcelanderIndian (Asian)IndonesianInupiatIranianIraqiIrishIroquoisIsraeliItalianJamaicanJapaneseJordanianKenyanKiowaKoreanLaotianLatvianLebaneseLiberianLithuanianLumbeeLuxembourgerMacedonianMalaysianMalteseMarshalleseMenomineeMexicanMexican American IndianMongolianMoroccanNative HawaiianNavajoNepaleseNew ZealanderNicaraguanNigerianNorthern EuropeanNorwegianOkinawanOsageOttawaPaiutePakistaniPalestinianPanamanianParaguayanPennsylvania GermanPeruvianPimaPolishPortuguesePotawatomiPuebloPuerto RicanPuget Sound SalishRomanianRussianSalvadoranSamoanScandinavianScotch-IrishScottishSeminoleSenegaleseSerbianShoshoneSierra LeoneanSiouxSlavicSlovakSloveneSomaliSouth AfricanSouth AmericanSouth American IndianSoviet UnionSpaniardSpanishSpanish AmericanSpanish American IndianSri LankanSubsaharan AfricanSudaneseSwedishSwissSyrianTaiwaneseThaiTlingit-HaidaTohono O'OdhamTonganTrinidadian and TobagonianTsimshianTurkishU.S. Virgin IslanderUgandanUkrainianUruguayanUteVenezuelanVietnameseWelshWest IndianYakamaYaquiYugoslavianYumanYup'ikZimbabwean
Immigration
NonimmigrantsImmigrantsAfghanistanAfricaAlbaniaArgentinaArmeniaAsiaAustraliaAustriaBahamasBangladeshBarbadosBelarusBelgiumBelizeBoliviaBosnia and HerzegovinaBrazilBulgariaBurma/MyanmarCabo VerdeCambodiaCameroonCanadaCaribbeanCentral AmericaChileChinaColombiaCongoCosta RicaCroatiaCubaCzechoslovakiaDenmarkDominicaDominican RepublicEastern AfricaEastern AsiaEastern EuropeEcuadorEgyptEl SalvadorEnglandEritreaEthiopiaEuropeFijiFranceGermanyGhanaGreeceGrenadaGuatemalaGuyanaHaitiHondurasHong KongHungaryIndiaIndonesiaIranIraqIrelandIsraelItalyJamaicaJapanJordanKazakhstanKenyaKoreaKuwaitLaosLatin AmericaLatviaLebanonLiberiaLithuaniaMalaysiaMexicoMicronesiaMiddle AfricaMoldovaMoroccoNepalNetherlandsNicaraguaNigeriaNorth AmericaNorth MacedoniaNorthern AfricaNorthern EuropeNorwayOceaniaPakistanPanamaPeruPhilippinesPolandPortugalRomaniaRussiaSaudi ArabiaScotlandSenegalSerbiaSierra LeoneSingaporeSomaliaSouth AfricaSouth AmericaSouth Central AsiaSouth Eastern AsiaSouthern EuropeSpainSri LankaSt. Vincent and the GrenadinesSudanSwedenSwitzerlandSyriaTaiwanThailandTrinidad and TobagoTurkeyUgandaUkraineUruguayUzbekistanVenezuelaVietnamWest IndiesWestern AfricaWestern AsiaWestern EuropeYemenZimbabweAzores
Immigrants from Zaire
Race
Ancestry
AfghanAfricanAlaska NativeAlaskan AthabascanAlbanianAleutAlsatianAmericanApacheArabArapahoArgentineanArmenianAssyrian/Chaldean/SyriacAustralianAustrianBahamianBangladeshiBarbadianBasqueBelgianBelizeanBermudanBhutaneseBlackfeetBolivianBrazilianBritishBritish West IndianBulgarianBurmeseCajunCambodianCanadianCape VerdeanCarpatho RusynCelticCentral AmericanCentral American IndianCherokeeCheyenneChickasawChileanChineseChippewaChoctawColombianColvilleComancheCosta RicanCreeCreekCroatianCrowCubanCypriotCzechCzechoslovakianDanishDelawareDominicanDutchDutch West IndianEastern EuropeanEcuadorianEgyptianEnglishEstonianEthiopianEuropeanFijianFilipinoFinnishFrenchFrench American IndianFrench CanadianGermanGerman RussianGhanaianGreekGuamanian/ChamorroGuatemalanGuyaneseHaitianHmongHonduranHopiHoumaHungarianIcelanderIndian (Asian)IndonesianInupiatIranianIraqiIrishIroquoisIsraeliItalianJamaicanJapaneseJordanianKenyanKiowaKoreanLaotianLatvianLebaneseLiberianLithuanianLumbeeLuxembourgerMacedonianMalaysianMalteseMarshalleseMenomineeMexicanMexican American IndianMongolianMoroccanNative HawaiianNavajoNepaleseNew ZealanderNicaraguanNigerianNorthern EuropeanNorwegianOkinawanOsageOttawaPaiutePakistaniPalestinianPanamanianParaguayanPennsylvania GermanPeruvianPimaPolishPortuguesePotawatomiPuebloPuerto RicanPuget Sound SalishRussianSalvadoranSamoanScandinavianScotch-IrishScottishSeminoleSenegaleseSerbianShoshoneSierra LeoneanSiouxSlavicSlovakSloveneSomaliSouth AfricanSouth AmericanSouth American IndianSoviet UnionSpaniardSpanishSpanish AmericanSpanish American IndianSri LankanSubsaharan AfricanSudaneseSwedishSwissSyrianTaiwaneseThaiTlingit-HaidaTohono O'OdhamTonganTrinidadian and TobagonianTsimshianTurkishU.S. Virgin IslanderUgandanUkrainianUruguayanUteVenezuelanVietnameseWelshWest IndianYakamaYaquiYugoslavianYumanYup'ikZimbabwean
Immigration
NonimmigrantsImmigrantsAfghanistanAfricaAlbaniaArgentinaArmeniaAsiaAustraliaAustriaBahamasBangladeshBarbadosBelarusBelgiumBelizeBoliviaBosnia and HerzegovinaBrazilBulgariaBurma/MyanmarCabo VerdeCambodiaCameroonCanadaCaribbeanCentral AmericaChileChinaColombiaCongoCosta RicaCroatiaCubaCzechoslovakiaDenmarkDominicaDominican RepublicEastern AfricaEastern AsiaEastern EuropeEcuadorEgyptEl SalvadorEnglandEritreaEthiopiaEuropeFijiFranceGermanyGhanaGreeceGrenadaGuatemalaGuyanaHaitiHondurasHong KongHungaryIndiaIndonesiaIranIraqIrelandIsraelItalyJamaicaJapanJordanKazakhstanKenyaKoreaKuwaitLaosLatin AmericaLatviaLebanonLiberiaLithuaniaMalaysiaMexicoMicronesiaMiddle AfricaMoldovaMoroccoNepalNetherlandsNicaraguaNigeriaNorth AmericaNorth MacedoniaNorthern AfricaNorthern EuropeNorwayOceaniaPakistanPanamaPeruPhilippinesPolandPortugalRomaniaRussiaSaudi ArabiaScotlandSenegalSerbiaSierra LeoneSingaporeSomaliaSouth AfricaSouth AmericaSouth Central AsiaSouth Eastern AsiaSouthern EuropeSpainSri LankaSt. Vincent and the GrenadinesSudanSwedenSwitzerlandSyriaTaiwanThailandTrinidad and TobagoTurkeyUgandaUkraineUruguayUzbekistanVenezuelaVietnamWest IndiesWestern AfricaWestern AsiaWestern EuropeYemenZaireZimbabweAzores
Single Mother Poverty
Income
Poverty
Unemployment
Labor Participation
Family Structure
Vehicle Availability
Education Level
Disability

Single Mother Poverty Comparison

Romanians

Immigrants from Zaire

Exceptional
Tragic
27.8%
SINGLE MOTHER POVERTY
97.8/ 100
METRIC RATING
93rd/ 347
METRIC RANK
32.0%
SINGLE MOTHER POVERTY
0.0/ 100
METRIC RATING
278th/ 347
METRIC RANK

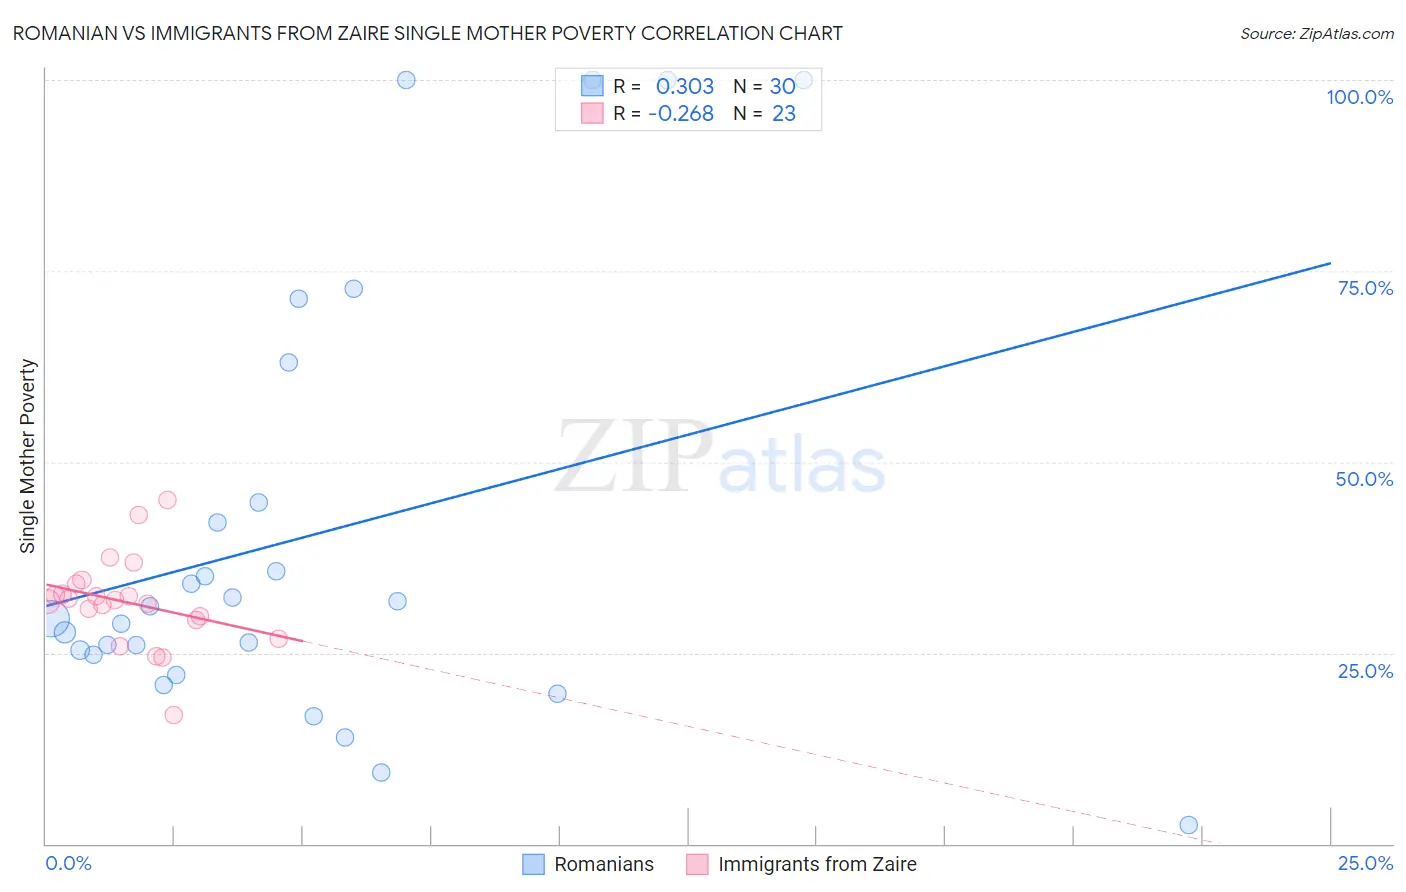
Romanian vs Immigrants from Zaire Single Mother Poverty Correlation Chart

The statistical analysis conducted on geographies consisting of 367,510,657 people shows a mild positive correlation between the proportion of Romanians and poverty level among single mothers in the United States with a correlation coefficient (R) of 0.303 and weighted average of 27.8%. Similarly, the statistical analysis conducted on geographies consisting of 106,703,532 people shows a weak negative correlation between the proportion of Immigrants from Zaire and poverty level among single mothers in the United States with a correlation coefficient (R) of -0.268 and weighted average of 32.0%, a difference of 14.8%.
Romanian vs Immigrants from Zaire Single Mother Poverty

Single Mother Poverty Correlation Summary

MeasurementRomanianImmigrants from Zaire
Minimum2.5%16.9%
Maximum100.0%45.1%
Range97.5%28.2%
Mean40.4%31.6%
Median30.2%31.9%
Interquartile 25% (IQ1)24.8%29.4%
Interquartile 75% (IQ3)44.7%34.1%
Interquartile Range (IQR)19.9%4.7%
Standard Deviation (Sample)28.4%5.9%
Standard Deviation (Population)27.9%5.8%

Similar Demographics by Single Mother Poverty

Demographics Similar to Romanians by Single Mother Poverty

In terms of single mother poverty, the demographic groups most similar to Romanians are Estonian (27.8%, a difference of 0.10%), Albanian (27.9%, a difference of 0.10%), Immigrants from Albania (27.8%, a difference of 0.12%), Chilean (27.9%, a difference of 0.13%), and Immigrants from Iraq (27.9%, a difference of 0.23%).
DemographicsRating | RankSingle Mother Poverty
Immigrants | Ukraine
98.6
/100
|
#86
Exceptional
27.7%
Afghans
98.5
/100
|
#87
Exceptional
27.7%
Ethiopians
98.4
/100
|
#88
Exceptional
27.7%
Immigrants | Ethiopia
98.4
/100
|
#89
Exceptional
27.7%
Immigrants | France
98.2
/100
|
#90
Exceptional
27.8%
Immigrants | Albania
98.0
/100
|
#91
Exceptional
27.8%
Estonians
97.9
/100
|
#92
Exceptional
27.8%
Romanians
97.8
/100
|
#93
Exceptional
27.8%
Albanians
97.6
/100
|
#94
Exceptional
27.9%
Chileans
97.5
/100
|
#95
Exceptional
27.9%
Immigrants | Iraq
97.3
/100
|
#96
Exceptional
27.9%
Immigrants | Brazil
97.2
/100
|
#97
Exceptional
27.9%
Immigrants | Nepal
97.2
/100
|
#98
Exceptional
27.9%
Immigrants | Netherlands
97.2
/100
|
#99
Exceptional
27.9%
Zimbabweans
97.1
/100
|
#100
Exceptional
27.9%

Demographics Similar to Immigrants from Zaire by Single Mother Poverty

In terms of single mother poverty, the demographic groups most similar to Immigrants from Zaire are Mexican American Indian (31.9%, a difference of 0.22%), Marshallese (32.1%, a difference of 0.40%), Delaware (31.8%, a difference of 0.43%), Central American (31.8%, a difference of 0.60%), and Nonimmigrants (32.2%, a difference of 0.62%).
DemographicsRating | RankSingle Mother Poverty
Immigrants | Cabo Verde
0.1
/100
|
#271
Tragic
31.6%
Immigrants | Micronesia
0.1
/100
|
#272
Tragic
31.6%
Fijians
0.1
/100
|
#273
Tragic
31.6%
Bangladeshis
0.1
/100
|
#274
Tragic
31.7%
Central Americans
0.1
/100
|
#275
Tragic
31.8%
Delaware
0.0
/100
|
#276
Tragic
31.8%
Mexican American Indians
0.0
/100
|
#277
Tragic
31.9%
Immigrants | Zaire
0.0
/100
|
#278
Tragic
32.0%
Marshallese
0.0
/100
|
#279
Tragic
32.1%
Immigrants | Nonimmigrants
0.0
/100
|
#280
Tragic
32.2%
Cree
0.0
/100
|
#281
Tragic
32.2%
Immigrants | Azores
0.0
/100
|
#282
Tragic
32.2%
Spanish Americans
0.0
/100
|
#283
Tragic
32.3%
Indonesians
0.0
/100
|
#284
Tragic
32.4%
Immigrants | Latin America
0.0
/100
|
#285
Tragic
32.4%