Romanian vs Immigrants from Italy Single Mother Poverty
COMPARE
Romanian
Immigrants from Italy
Single Mother Poverty
Single Mother Poverty Comparison
Romanians
Immigrants from Italy
27.8%
SINGLE MOTHER POVERTY
97.8/ 100
METRIC RATING
93rd/ 347
METRIC RANK
27.5%
SINGLE MOTHER POVERTY
99.1/ 100
METRIC RATING
79th/ 347
METRIC RANK
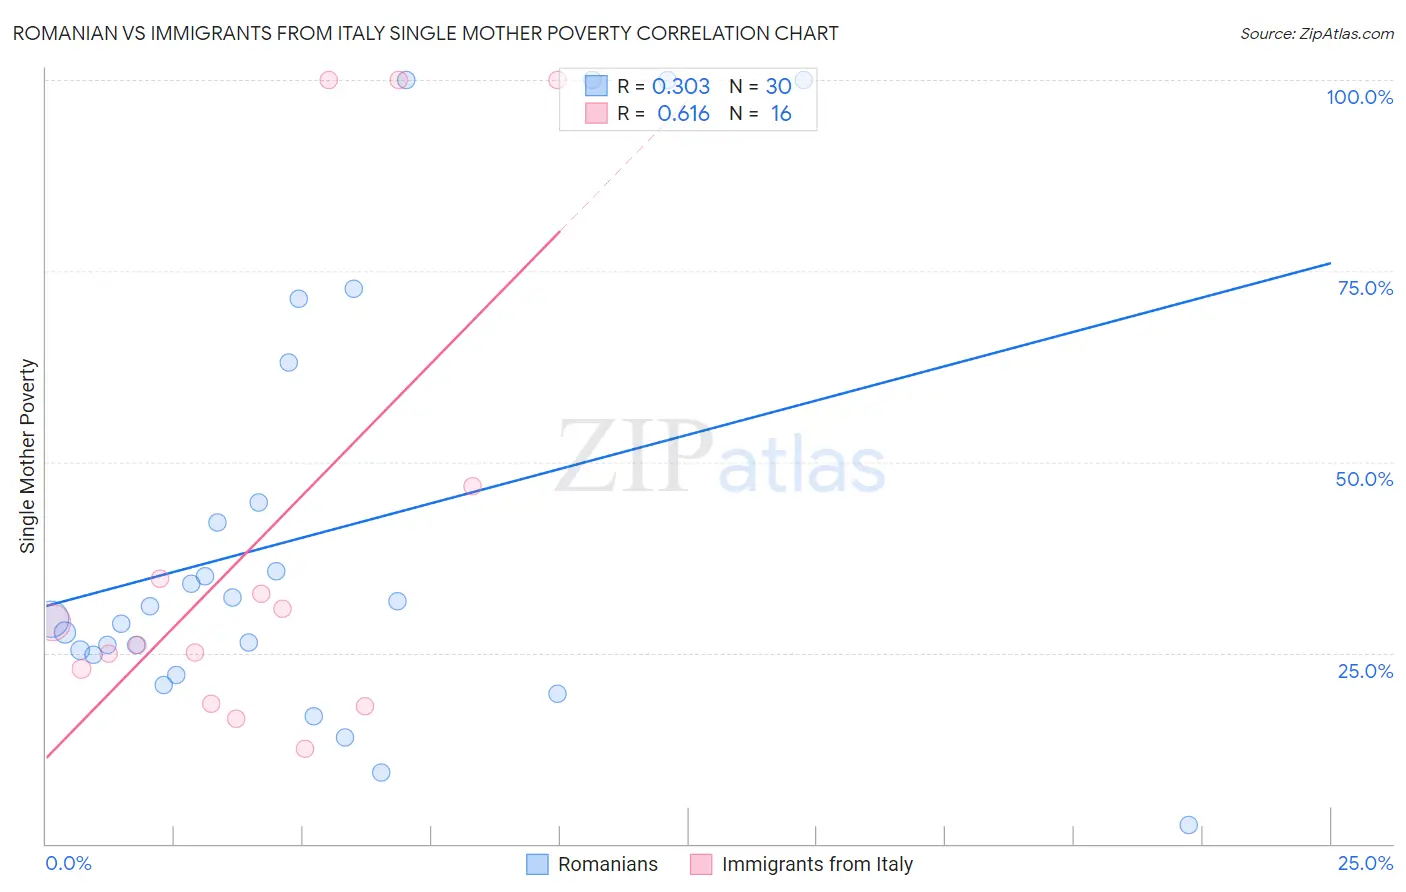
Romanian vs Immigrants from Italy Single Mother Poverty Correlation Chart
The statistical analysis conducted on geographies consisting of 367,510,657 people shows a mild positive correlation between the proportion of Romanians and poverty level among single mothers in the United States with a correlation coefficient (R) of 0.303 and weighted average of 27.8%. Similarly, the statistical analysis conducted on geographies consisting of 315,189,734 people shows a significant positive correlation between the proportion of Immigrants from Italy and poverty level among single mothers in the United States with a correlation coefficient (R) of 0.616 and weighted average of 27.5%, a difference of 1.2%.
Single Mother Poverty Correlation Summary
| Measurement | Romanian | Immigrants from Italy |
| Minimum | 2.5% | 12.5% |
| Maximum | 100.0% | 100.0% |
| Range | 97.5% | 87.5% |
| Mean | 40.4% | 39.9% |
| Median | 30.2% | 27.5% |
| Interquartile 25% (IQ1) | 24.8% | 20.6% |
| Interquartile 75% (IQ3) | 44.7% | 40.7% |
| Interquartile Range (IQR) | 19.9% | 20.1% |
| Standard Deviation (Sample) | 28.4% | 30.9% |
| Standard Deviation (Population) | 27.9% | 29.9% |
Demographics Similar to Romanians and Immigrants from Italy by Single Mother Poverty
In terms of single mother poverty, the demographic groups most similar to Romanians are Estonian (27.8%, a difference of 0.10%), Albanian (27.9%, a difference of 0.10%), Immigrants from Albania (27.8%, a difference of 0.12%), Chilean (27.9%, a difference of 0.13%), and Immigrants from Iraq (27.9%, a difference of 0.23%). Similarly, the demographic groups most similar to Immigrants from Italy are Taiwanese (27.5%, a difference of 0.0%), Immigrants from North Macedonia (27.5%, a difference of 0.030%), Immigrants from Peru (27.5%, a difference of 0.050%), Peruvian (27.5%, a difference of 0.070%), and Immigrants from Scotland (27.6%, a difference of 0.34%).
| Demographics | Rating | Rank | Single Mother Poverty |
| Peruvians | 99.2 /100 | #76 | Exceptional 27.5% |
| Immigrants | Peru | 99.2 /100 | #77 | Exceptional 27.5% |
| Immigrants | North Macedonia | 99.2 /100 | #78 | Exceptional 27.5% |
| Immigrants | Italy | 99.1 /100 | #79 | Exceptional 27.5% |
| Taiwanese | 99.1 /100 | #80 | Exceptional 27.5% |
| Immigrants | Scotland | 98.9 /100 | #81 | Exceptional 27.6% |
| Immigrants | Cameroon | 98.8 /100 | #82 | Exceptional 27.6% |
| Greeks | 98.7 /100 | #83 | Exceptional 27.7% |
| Immigrants | Latvia | 98.7 /100 | #84 | Exceptional 27.7% |
| Mongolians | 98.7 /100 | #85 | Exceptional 27.7% |
| Immigrants | Ukraine | 98.6 /100 | #86 | Exceptional 27.7% |
| Afghans | 98.5 /100 | #87 | Exceptional 27.7% |
| Ethiopians | 98.4 /100 | #88 | Exceptional 27.7% |
| Immigrants | Ethiopia | 98.4 /100 | #89 | Exceptional 27.7% |
| Immigrants | France | 98.2 /100 | #90 | Exceptional 27.8% |
| Immigrants | Albania | 98.0 /100 | #91 | Exceptional 27.8% |
| Estonians | 97.9 /100 | #92 | Exceptional 27.8% |
| Romanians | 97.8 /100 | #93 | Exceptional 27.8% |
| Albanians | 97.6 /100 | #94 | Exceptional 27.9% |
| Chileans | 97.5 /100 | #95 | Exceptional 27.9% |
| Immigrants | Iraq | 97.3 /100 | #96 | Exceptional 27.9% |