Puerto Rican vs Immigrants from Barbados Householder Income Ages 45 - 64 years
COMPARE
Puerto Rican
Immigrants from Barbados
Householder Income Ages 45 - 64 years
Householder Income Ages 45 - 64 years Comparison
Puerto Ricans
Immigrants from Barbados
$69,234
HOUSEHOLDER INCOME AGES 45 - 64 YEARS
0.0/ 100
METRIC RATING
346th/ 347
METRIC RANK
$89,394
HOUSEHOLDER INCOME AGES 45 - 64 YEARS
0.4/ 100
METRIC RATING
258th/ 347
METRIC RANK
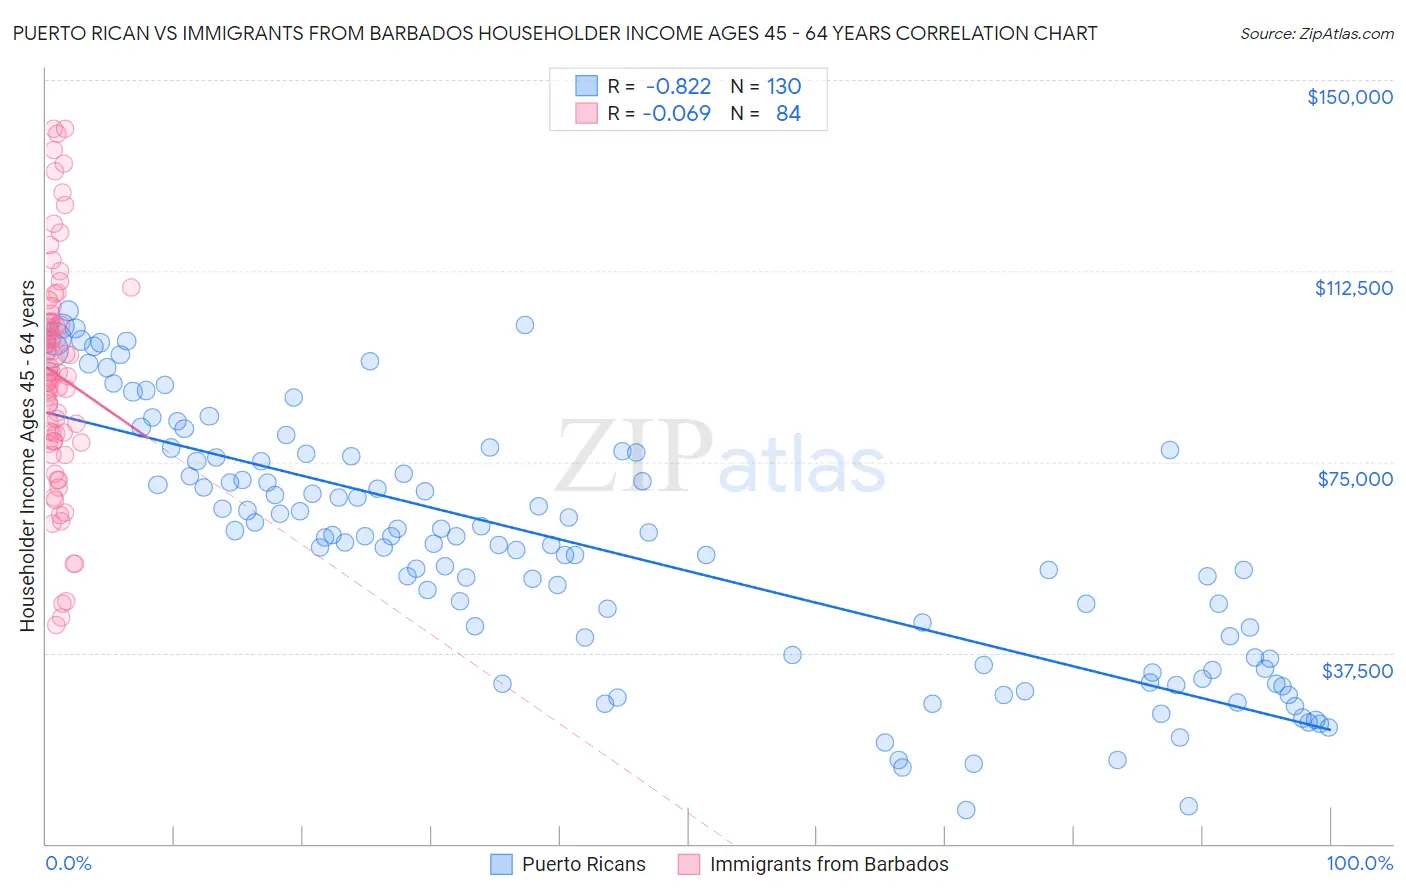
Puerto Rican vs Immigrants from Barbados Householder Income Ages 45 - 64 years Correlation Chart
The statistical analysis conducted on geographies consisting of 526,175,846 people shows a very strong negative correlation between the proportion of Puerto Ricans and household income with householder between the ages 45 and 64 in the United States with a correlation coefficient (R) of -0.822 and weighted average of $69,234. Similarly, the statistical analysis conducted on geographies consisting of 112,734,331 people shows a slight negative correlation between the proportion of Immigrants from Barbados and household income with householder between the ages 45 and 64 in the United States with a correlation coefficient (R) of -0.069 and weighted average of $89,394, a difference of 29.1%.
Householder Income Ages 45 - 64 years Correlation Summary
| Measurement | Puerto Rican | Immigrants from Barbados |
| Minimum | $6,600 | $42,917 |
| Maximum | $104,645 | $140,429 |
| Range | $98,045 | $97,512 |
| Mean | $58,161 | $92,160 |
| Median | $60,296 | $92,269 |
| Interquartile 25% (IQ1) | $36,266 | $79,098 |
| Interquartile 75% (IQ3) | $75,781 | $102,596 |
| Interquartile Range (IQR) | $39,515 | $23,498 |
| Standard Deviation (Sample) | $24,341 | $21,991 |
| Standard Deviation (Population) | $24,247 | $21,860 |
Similar Demographics by Householder Income Ages 45 - 64 years
Demographics Similar to Puerto Ricans by Householder Income Ages 45 - 64 years
In terms of householder income ages 45 - 64 years, the demographic groups most similar to Puerto Ricans are Navajo ($69,759, a difference of 0.76%), Houma ($72,093, a difference of 4.1%), Pima ($73,365, a difference of 6.0%), Lumbee ($65,113, a difference of 6.3%), and Tohono O'odham ($73,774, a difference of 6.6%).
| Demographics | Rating | Rank | Householder Income Ages 45 - 64 years |
| Immigrants | Congo | 0.0 /100 | #333 | Tragic $77,850 |
| Menominee | 0.0 /100 | #334 | Tragic $76,903 |
| Cheyenne | 0.0 /100 | #335 | Tragic $76,362 |
| Arapaho | 0.0 /100 | #336 | Tragic $75,945 |
| Pueblo | 0.0 /100 | #337 | Tragic $75,601 |
| Hopi | 0.0 /100 | #338 | Tragic $75,562 |
| Kiowa | 0.0 /100 | #339 | Tragic $74,815 |
| Immigrants | Yemen | 0.0 /100 | #340 | Tragic $74,575 |
| Crow | 0.0 /100 | #341 | Tragic $74,257 |
| Tohono O'odham | 0.0 /100 | #342 | Tragic $73,774 |
| Pima | 0.0 /100 | #343 | Tragic $73,365 |
| Houma | 0.0 /100 | #344 | Tragic $72,093 |
| Navajo | 0.0 /100 | #345 | Tragic $69,759 |
| Puerto Ricans | 0.0 /100 | #346 | Tragic $69,234 |
| Lumbee | 0.0 /100 | #347 | Tragic $65,113 |
Demographics Similar to Immigrants from Barbados by Householder Income Ages 45 - 64 years
In terms of householder income ages 45 - 64 years, the demographic groups most similar to Immigrants from Barbados are German Russian ($89,398, a difference of 0.0%), Immigrants from Nicaragua ($89,108, a difference of 0.32%), French American Indian ($89,811, a difference of 0.47%), Liberian ($88,929, a difference of 0.52%), and West Indian ($89,906, a difference of 0.57%).
| Demographics | Rating | Rank | Householder Income Ages 45 - 64 years |
| Americans | 0.7 /100 | #251 | Tragic $90,536 |
| Marshallese | 0.7 /100 | #252 | Tragic $90,455 |
| Barbadians | 0.6 /100 | #253 | Tragic $90,266 |
| Immigrants | Guyana | 0.6 /100 | #254 | Tragic $90,186 |
| West Indians | 0.5 /100 | #255 | Tragic $89,906 |
| French American Indians | 0.5 /100 | #256 | Tragic $89,811 |
| German Russians | 0.4 /100 | #257 | Tragic $89,398 |
| Immigrants | Barbados | 0.4 /100 | #258 | Tragic $89,394 |
| Immigrants | Nicaragua | 0.4 /100 | #259 | Tragic $89,108 |
| Liberians | 0.3 /100 | #260 | Tragic $88,929 |
| Belizeans | 0.3 /100 | #261 | Tragic $88,684 |
| Somalis | 0.3 /100 | #262 | Tragic $88,600 |
| Immigrants | Senegal | 0.3 /100 | #263 | Tragic $88,421 |
| Osage | 0.3 /100 | #264 | Tragic $88,390 |
| Jamaicans | 0.2 /100 | #265 | Tragic $88,327 |