Pueblo vs Sri Lankan Single Mother Poverty
COMPARE
Pueblo
Sri Lankan
Single Mother Poverty
Single Mother Poverty Comparison
Pueblo
Sri Lankans
37.2%
SINGLE MOTHER POVERTY
0.0/ 100
METRIC RATING
334th/ 347
METRIC RANK
26.7%
SINGLE MOTHER POVERTY
99.9/ 100
METRIC RATING
39th/ 347
METRIC RANK
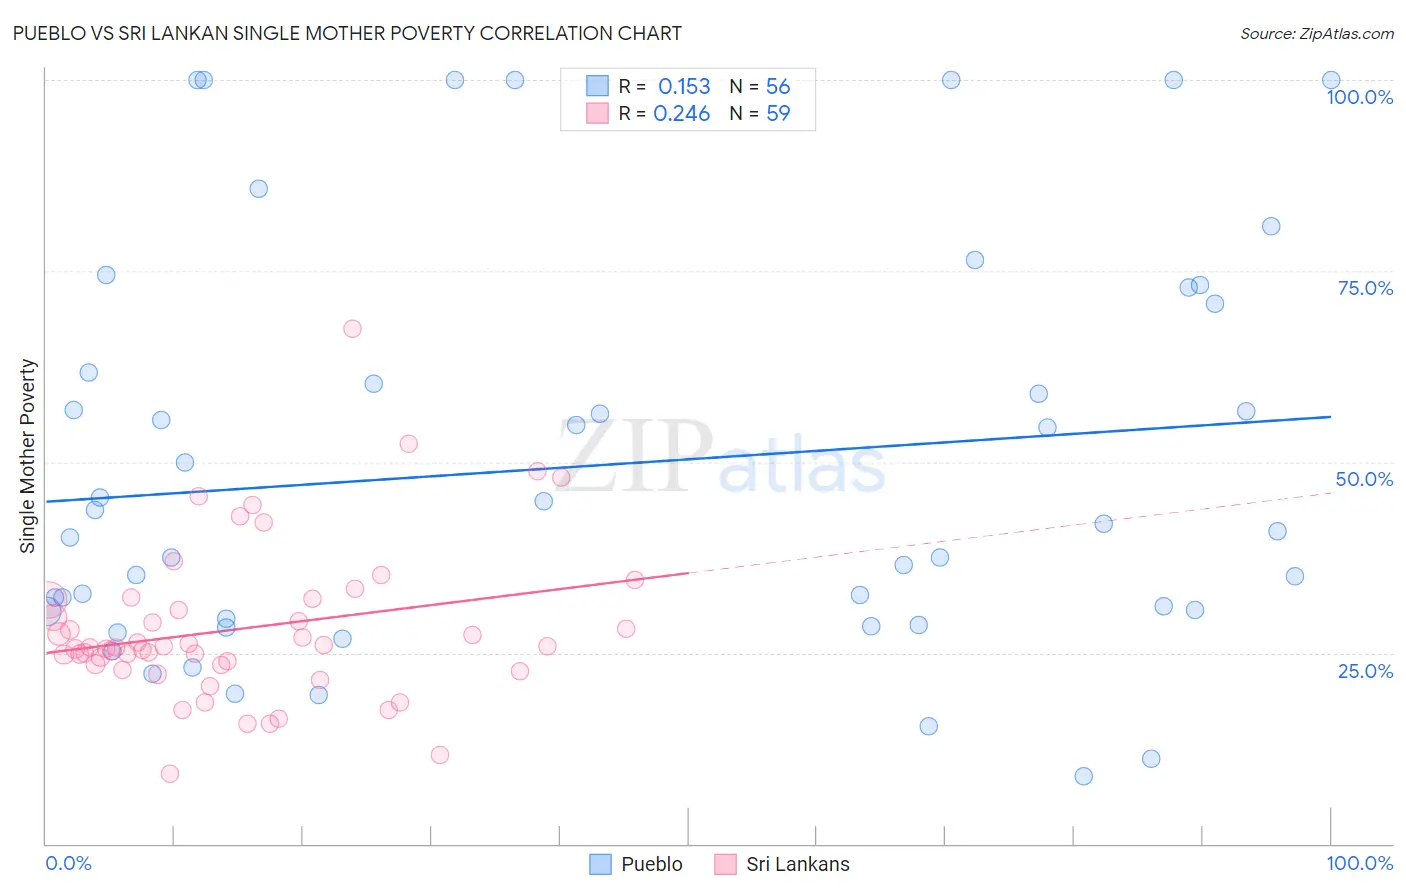
Pueblo vs Sri Lankan Single Mother Poverty Correlation Chart
The statistical analysis conducted on geographies consisting of 119,257,256 people shows a poor positive correlation between the proportion of Pueblo and poverty level among single mothers in the United States with a correlation coefficient (R) of 0.153 and weighted average of 37.2%. Similarly, the statistical analysis conducted on geographies consisting of 429,454,799 people shows a weak positive correlation between the proportion of Sri Lankans and poverty level among single mothers in the United States with a correlation coefficient (R) of 0.246 and weighted average of 26.7%, a difference of 39.3%.
Single Mother Poverty Correlation Summary
| Measurement | Pueblo | Sri Lankan |
| Minimum | 8.8% | 9.1% |
| Maximum | 100.0% | 67.5% |
| Range | 91.2% | 58.4% |
| Mean | 49.5% | 28.2% |
| Median | 41.4% | 25.7% |
| Interquartile 25% (IQ1) | 30.0% | 23.5% |
| Interquartile 75% (IQ3) | 66.2% | 31.9% |
| Interquartile Range (IQR) | 36.2% | 8.4% |
| Standard Deviation (Sample) | 26.2% | 10.2% |
| Standard Deviation (Population) | 26.0% | 10.1% |
Similar Demographics by Single Mother Poverty
Demographics Similar to Pueblo by Single Mother Poverty
In terms of single mother poverty, the demographic groups most similar to Pueblo are Menominee (37.1%, a difference of 0.37%), Dutch West Indian (36.8%, a difference of 1.2%), Creek (36.7%, a difference of 1.4%), Yuman (37.8%, a difference of 1.5%), and Native/Alaskan (36.6%, a difference of 1.6%).
| Demographics | Rating | Rank | Single Mother Poverty |
| Yakama | 0.0 /100 | #327 | Tragic 36.4% |
| Choctaw | 0.0 /100 | #328 | Tragic 36.4% |
| Apache | 0.0 /100 | #329 | Tragic 36.6% |
| Natives/Alaskans | 0.0 /100 | #330 | Tragic 36.6% |
| Creek | 0.0 /100 | #331 | Tragic 36.7% |
| Dutch West Indians | 0.0 /100 | #332 | Tragic 36.8% |
| Menominee | 0.0 /100 | #333 | Tragic 37.1% |
| Pueblo | 0.0 /100 | #334 | Tragic 37.2% |
| Yuman | 0.0 /100 | #335 | Tragic 37.8% |
| Cheyenne | 0.0 /100 | #336 | Tragic 38.5% |
| Immigrants | Yemen | 0.0 /100 | #337 | Tragic 38.5% |
| Pima | 0.0 /100 | #338 | Tragic 38.6% |
| Crow | 0.0 /100 | #339 | Tragic 38.6% |
| Sioux | 0.0 /100 | #340 | Tragic 38.8% |
| Colville | 0.0 /100 | #341 | Tragic 39.3% |
Demographics Similar to Sri Lankans by Single Mother Poverty
In terms of single mother poverty, the demographic groups most similar to Sri Lankans are Immigrants from Vietnam (26.7%, a difference of 0.090%), Immigrants from Greece (26.7%, a difference of 0.17%), Immigrants from Fiji (26.6%, a difference of 0.33%), Immigrants from Israel (26.6%, a difference of 0.37%), and Okinawan (26.6%, a difference of 0.38%).
| Demographics | Rating | Rank | Single Mother Poverty |
| Tongans | 99.9 /100 | #32 | Exceptional 26.5% |
| Bulgarians | 99.9 /100 | #33 | Exceptional 26.5% |
| Immigrants | Indonesia | 99.9 /100 | #34 | Exceptional 26.6% |
| Maltese | 99.9 /100 | #35 | Exceptional 26.6% |
| Okinawans | 99.9 /100 | #36 | Exceptional 26.6% |
| Immigrants | Israel | 99.9 /100 | #37 | Exceptional 26.6% |
| Immigrants | Fiji | 99.9 /100 | #38 | Exceptional 26.6% |
| Sri Lankans | 99.9 /100 | #39 | Exceptional 26.7% |
| Immigrants | Vietnam | 99.9 /100 | #40 | Exceptional 26.7% |
| Immigrants | Greece | 99.9 /100 | #41 | Exceptional 26.7% |
| Armenians | 99.9 /100 | #42 | Exceptional 26.8% |
| Tsimshian | 99.9 /100 | #43 | Exceptional 26.8% |
| Immigrants | Sierra Leone | 99.9 /100 | #44 | Exceptional 26.9% |
| Latvians | 99.9 /100 | #45 | Exceptional 26.9% |
| Immigrants | Serbia | 99.9 /100 | #46 | Exceptional 26.9% |