Pueblo vs Sri Lankan In Labor Force | Age 20-24
COMPARE
Pueblo
Sri Lankan
In Labor Force | Age 20-24
In Labor Force | Age 20-24 Comparison
Pueblo
Sri Lankans
72.9%
IN LABOR FORCE | AGE 20-24
0.0/ 100
METRIC RATING
292nd/ 347
METRIC RANK
74.9%
IN LABOR FORCE | AGE 20-24
34.9/ 100
METRIC RATING
185th/ 347
METRIC RANK
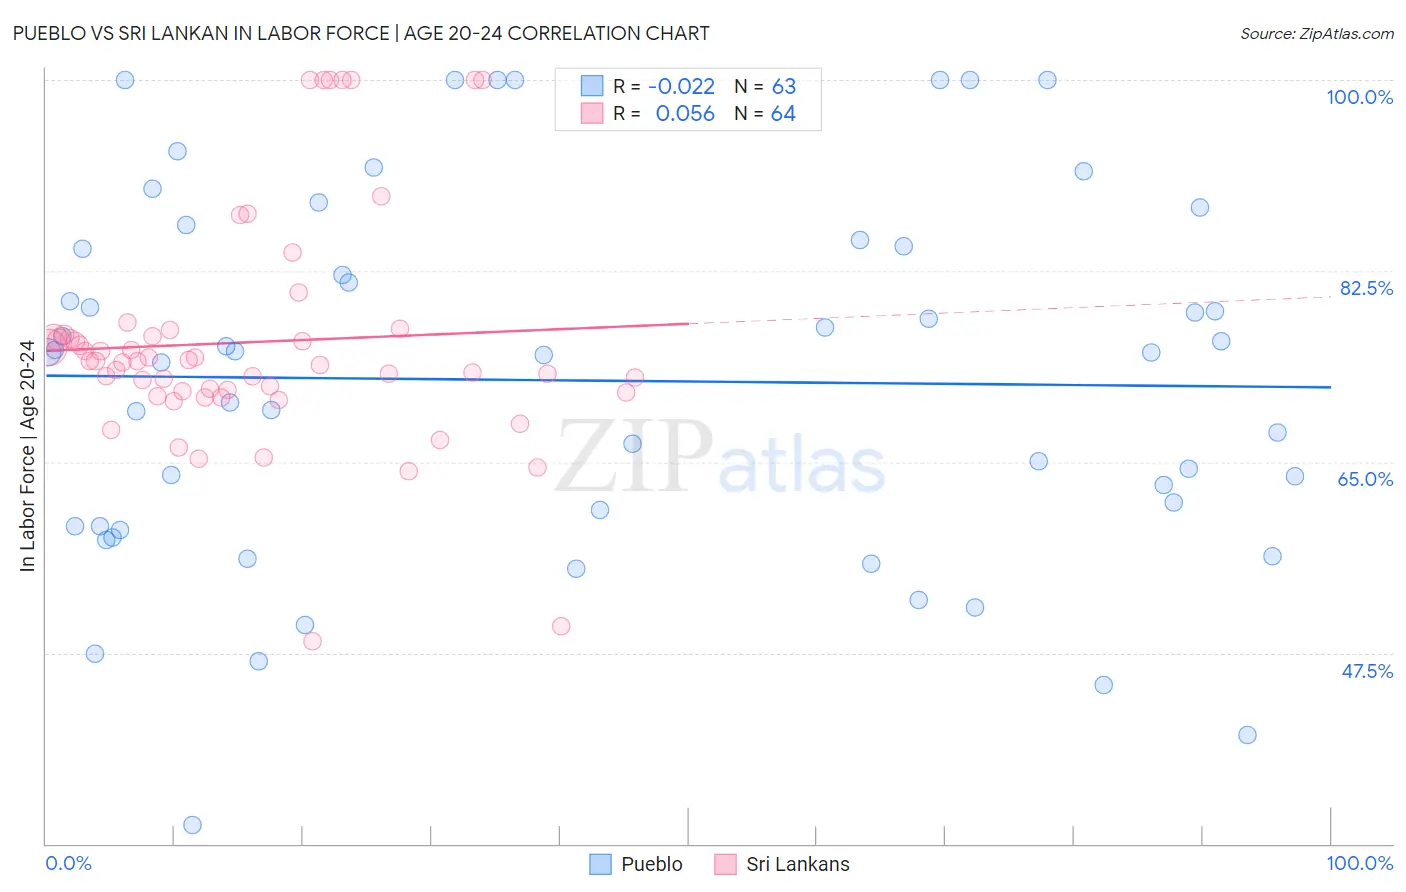
Pueblo vs Sri Lankan In Labor Force | Age 20-24 Correlation Chart
The statistical analysis conducted on geographies consisting of 120,061,878 people shows no correlation between the proportion of Pueblo and labor force participation rate among population between the ages 20 and 24 in the United States with a correlation coefficient (R) of -0.022 and weighted average of 72.9%. Similarly, the statistical analysis conducted on geographies consisting of 440,468,605 people shows a slight positive correlation between the proportion of Sri Lankans and labor force participation rate among population between the ages 20 and 24 in the United States with a correlation coefficient (R) of 0.056 and weighted average of 74.9%, a difference of 2.8%.
In Labor Force | Age 20-24 Correlation Summary
| Measurement | Pueblo | Sri Lankan |
| Minimum | 31.7% | 48.6% |
| Maximum | 100.0% | 100.0% |
| Range | 68.3% | 51.4% |
| Mean | 72.5% | 76.0% |
| Median | 75.0% | 74.2% |
| Interquartile 25% (IQ1) | 59.1% | 71.4% |
| Interquartile 75% (IQ3) | 84.8% | 76.6% |
| Interquartile Range (IQR) | 25.7% | 5.2% |
| Standard Deviation (Sample) | 16.7% | 10.7% |
| Standard Deviation (Population) | 16.6% | 10.6% |
Similar Demographics by In Labor Force | Age 20-24
Demographics Similar to Pueblo by In Labor Force | Age 20-24
In terms of in labor force | age 20-24, the demographic groups most similar to Pueblo are Immigrants from Belize (72.8%, a difference of 0.060%), Immigrants from Nicaragua (72.9%, a difference of 0.090%), Immigrants from Argentina (72.8%, a difference of 0.090%), Immigrants from Belarus (73.0%, a difference of 0.17%), and Okinawan (72.7%, a difference of 0.20%).
| Demographics | Rating | Rank | In Labor Force | Age 20-24 |
| Nicaraguans | 0.1 /100 | #285 | Tragic 73.2% |
| Immigrants | Lebanon | 0.1 /100 | #286 | Tragic 73.1% |
| Immigrants | Korea | 0.1 /100 | #287 | Tragic 73.1% |
| Argentineans | 0.1 /100 | #288 | Tragic 73.1% |
| U.S. Virgin Islanders | 0.1 /100 | #289 | Tragic 73.0% |
| Immigrants | Belarus | 0.1 /100 | #290 | Tragic 73.0% |
| Immigrants | Nicaragua | 0.0 /100 | #291 | Tragic 72.9% |
| Pueblo | 0.0 /100 | #292 | Tragic 72.9% |
| Immigrants | Belize | 0.0 /100 | #293 | Tragic 72.8% |
| Immigrants | Argentina | 0.0 /100 | #294 | Tragic 72.8% |
| Okinawans | 0.0 /100 | #295 | Tragic 72.7% |
| Jamaicans | 0.0 /100 | #296 | Tragic 72.7% |
| Central American Indians | 0.0 /100 | #297 | Tragic 72.7% |
| Israelis | 0.0 /100 | #298 | Tragic 72.6% |
| Iranians | 0.0 /100 | #299 | Tragic 72.6% |
Demographics Similar to Sri Lankans by In Labor Force | Age 20-24
In terms of in labor force | age 20-24, the demographic groups most similar to Sri Lankans are Immigrants from Hungary (74.9%, a difference of 0.0%), Immigrants from Eastern Europe (74.9%, a difference of 0.020%), Immigrants from Honduras (74.9%, a difference of 0.020%), Immigrants from South Africa (74.9%, a difference of 0.030%), and Immigrants from Costa Rica (74.9%, a difference of 0.030%).
| Demographics | Rating | Rank | In Labor Force | Age 20-24 |
| Immigrants | Central America | 45.0 /100 | #178 | Average 75.0% |
| Immigrants | Latvia | 44.1 /100 | #179 | Average 75.0% |
| Immigrants | Czechoslovakia | 44.0 /100 | #180 | Average 75.0% |
| Africans | 42.5 /100 | #181 | Average 75.0% |
| Immigrants | South Africa | 36.9 /100 | #182 | Fair 74.9% |
| Immigrants | Costa Rica | 36.7 /100 | #183 | Fair 74.9% |
| Immigrants | Hungary | 35.0 /100 | #184 | Fair 74.9% |
| Sri Lankans | 34.9 /100 | #185 | Fair 74.9% |
| Immigrants | Eastern Europe | 33.8 /100 | #186 | Fair 74.9% |
| Immigrants | Honduras | 33.5 /100 | #187 | Fair 74.9% |
| Hondurans | 32.7 /100 | #188 | Fair 74.8% |
| Immigrants | Northern Europe | 32.6 /100 | #189 | Fair 74.8% |
| Russians | 32.2 /100 | #190 | Fair 74.8% |
| Senegalese | 28.1 /100 | #191 | Fair 74.8% |
| Immigrants | Europe | 27.5 /100 | #192 | Fair 74.8% |