Potawatomi vs South American Indian Single Female Poverty
COMPARE
Potawatomi
South American Indian
Single Female Poverty
Single Female Poverty Comparison
Potawatomi
South American Indians
25.4%
SINGLE FEMALE POVERTY
0.0/ 100
METRIC RATING
307th/ 347
METRIC RANK
20.6%
SINGLE FEMALE POVERTY
75.7/ 100
METRIC RATING
156th/ 347
METRIC RANK
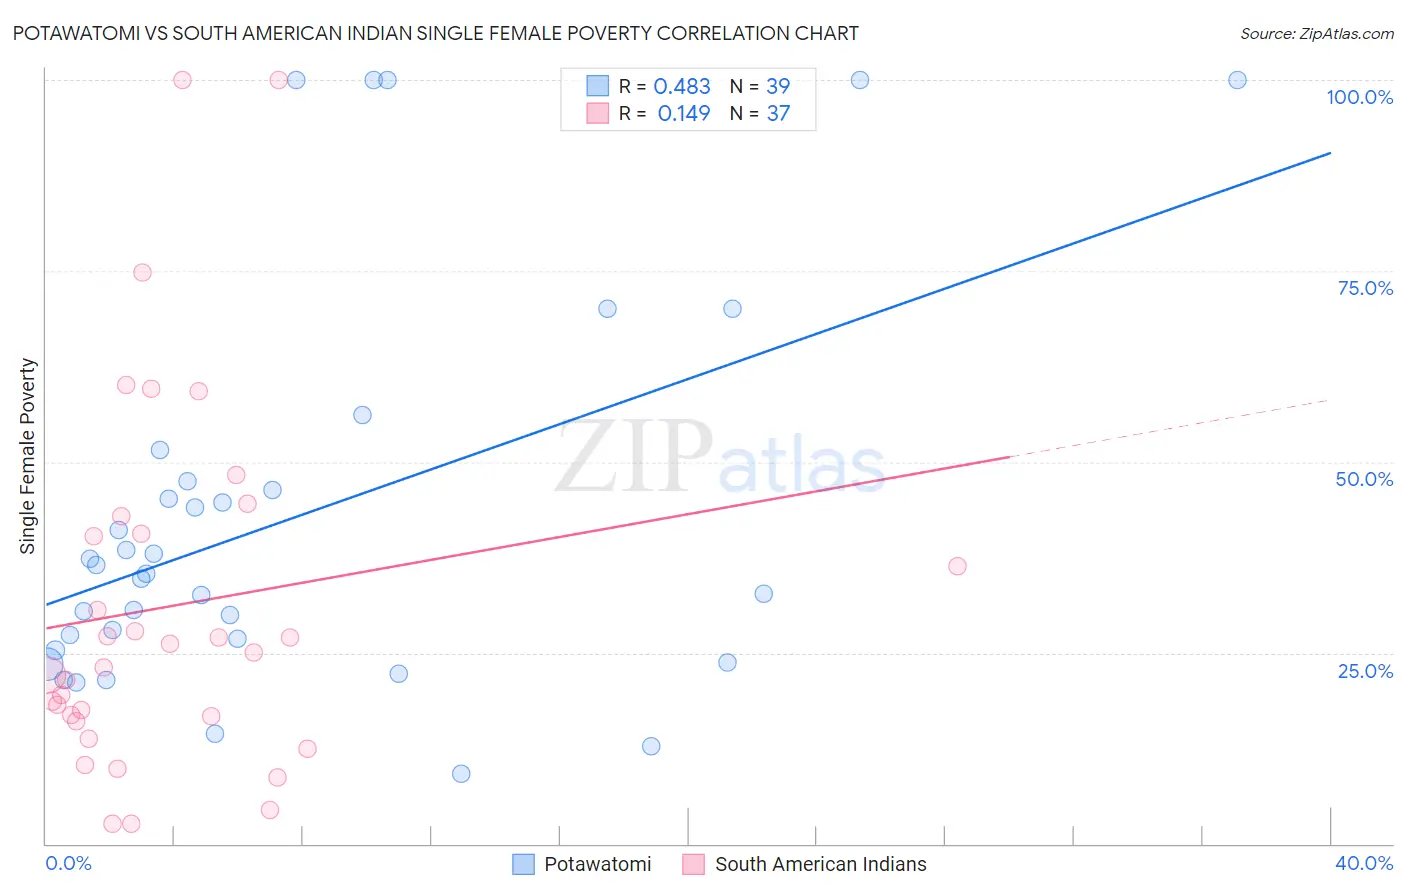
Potawatomi vs South American Indian Single Female Poverty Correlation Chart
The statistical analysis conducted on geographies consisting of 117,128,291 people shows a moderate positive correlation between the proportion of Potawatomi and poverty level among single females in the United States with a correlation coefficient (R) of 0.483 and weighted average of 25.4%. Similarly, the statistical analysis conducted on geographies consisting of 163,615,516 people shows a poor positive correlation between the proportion of South American Indians and poverty level among single females in the United States with a correlation coefficient (R) of 0.149 and weighted average of 20.6%, a difference of 23.0%.
Single Female Poverty Correlation Summary
| Measurement | Potawatomi | South American Indian |
| Minimum | 9.1% | 2.6% |
| Maximum | 100.0% | 100.0% |
| Range | 90.9% | 97.4% |
| Mean | 42.8% | 31.1% |
| Median | 35.3% | 25.0% |
| Interquartile 25% (IQ1) | 25.3% | 16.4% |
| Interquartile 75% (IQ3) | 47.5% | 41.7% |
| Interquartile Range (IQR) | 22.2% | 25.3% |
| Standard Deviation (Sample) | 25.9% | 24.0% |
| Standard Deviation (Population) | 25.5% | 23.6% |
Similar Demographics by Single Female Poverty
Demographics Similar to Potawatomi by Single Female Poverty
In terms of single female poverty, the demographic groups most similar to Potawatomi are Aleut (25.4%, a difference of 0.17%), Dominican (25.4%, a difference of 0.18%), Immigrants from Mexico (25.3%, a difference of 0.23%), Immigrants from Dominican Republic (25.3%, a difference of 0.32%), and Central American Indian (25.5%, a difference of 0.33%).
| Demographics | Rating | Rank | Single Female Poverty |
| Blackfeet | 0.0 /100 | #300 | Tragic 25.1% |
| Hondurans | 0.0 /100 | #301 | Tragic 25.1% |
| Shoshone | 0.0 /100 | #302 | Tragic 25.1% |
| Somalis | 0.0 /100 | #303 | Tragic 25.2% |
| Immigrants | Congo | 0.0 /100 | #304 | Tragic 25.3% |
| Immigrants | Dominican Republic | 0.0 /100 | #305 | Tragic 25.3% |
| Immigrants | Mexico | 0.0 /100 | #306 | Tragic 25.3% |
| Potawatomi | 0.0 /100 | #307 | Tragic 25.4% |
| Aleuts | 0.0 /100 | #308 | Tragic 25.4% |
| Dominicans | 0.0 /100 | #309 | Tragic 25.4% |
| Central American Indians | 0.0 /100 | #310 | Tragic 25.5% |
| Immigrants | Honduras | 0.0 /100 | #311 | Tragic 25.5% |
| Paiute | 0.0 /100 | #312 | Tragic 25.5% |
| Comanche | 0.0 /100 | #313 | Tragic 25.6% |
| Cherokee | 0.0 /100 | #314 | Tragic 25.7% |
Demographics Similar to South American Indians by Single Female Poverty
In terms of single female poverty, the demographic groups most similar to South American Indians are Samoan (20.6%, a difference of 0.030%), Immigrants from Western Europe (20.6%, a difference of 0.10%), Immigrants from Oceania (20.7%, a difference of 0.12%), Swedish (20.6%, a difference of 0.13%), and Immigrants from Uruguay (20.6%, a difference of 0.18%).
| Demographics | Rating | Rank | Single Female Poverty |
| Portuguese | 81.5 /100 | #149 | Excellent 20.5% |
| Immigrants | Denmark | 80.5 /100 | #150 | Excellent 20.5% |
| Puget Sound Salish | 79.6 /100 | #151 | Good 20.6% |
| Immigrants | Uruguay | 77.7 /100 | #152 | Good 20.6% |
| Swedes | 77.1 /100 | #153 | Good 20.6% |
| Immigrants | Western Europe | 76.7 /100 | #154 | Good 20.6% |
| Samoans | 76.0 /100 | #155 | Good 20.6% |
| South American Indians | 75.7 /100 | #156 | Good 20.6% |
| Immigrants | Oceania | 74.3 /100 | #157 | Good 20.7% |
| Danes | 73.0 /100 | #158 | Good 20.7% |
| Costa Ricans | 71.8 /100 | #159 | Good 20.7% |
| Arabs | 70.8 /100 | #160 | Good 20.7% |
| Kenyans | 68.5 /100 | #161 | Good 20.8% |
| Northern Europeans | 68.4 /100 | #162 | Good 20.8% |
| Lebanese | 67.6 /100 | #163 | Good 20.8% |