Polish vs Immigrants from West Indies Receiving Food Stamps
COMPARE
Polish
Immigrants from West Indies
Receiving Food Stamps
Receiving Food Stamps Comparison
Poles
Immigrants from West Indies
10.0%
RECEIVING FOOD STAMPS
98.6/ 100
METRIC RATING
80th/ 347
METRIC RANK
16.1%
RECEIVING FOOD STAMPS
0.0/ 100
METRIC RATING
302nd/ 347
METRIC RANK
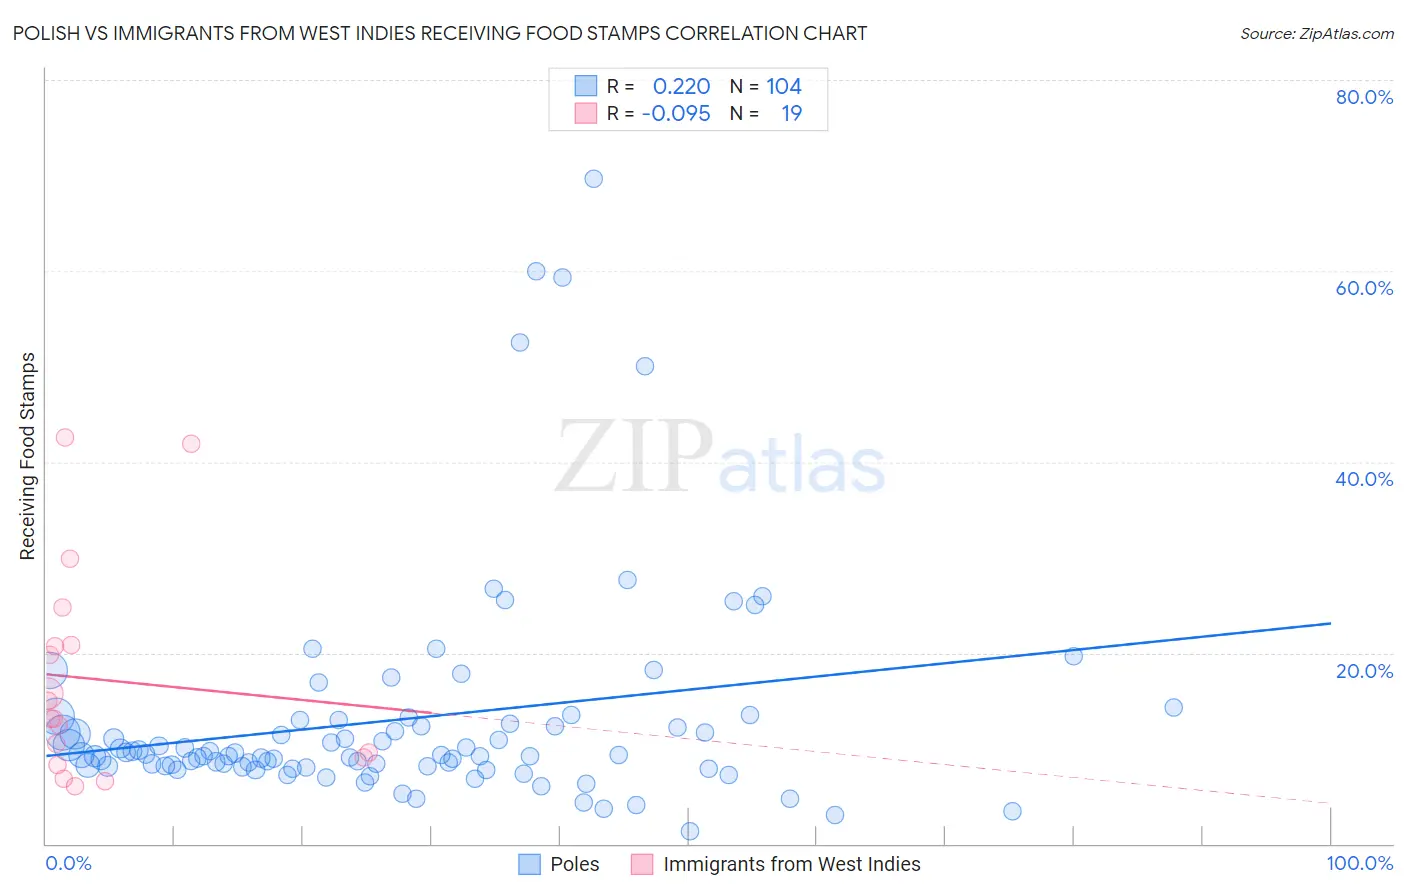
Polish vs Immigrants from West Indies Receiving Food Stamps Correlation Chart
The statistical analysis conducted on geographies consisting of 556,985,146 people shows a weak positive correlation between the proportion of Poles and percentage of population receiving government assistance and/or food stamps in the United States with a correlation coefficient (R) of 0.220 and weighted average of 10.0%. Similarly, the statistical analysis conducted on geographies consisting of 72,442,413 people shows a slight negative correlation between the proportion of Immigrants from West Indies and percentage of population receiving government assistance and/or food stamps in the United States with a correlation coefficient (R) of -0.095 and weighted average of 16.1%, a difference of 61.7%.
Receiving Food Stamps Correlation Summary
| Measurement | Polish | Immigrants from West Indies |
| Minimum | 1.3% | 6.0% |
| Maximum | 69.7% | 42.5% |
| Range | 68.4% | 36.5% |
| Mean | 13.0% | 17.2% |
| Median | 9.3% | 13.1% |
| Interquartile 25% (IQ1) | 8.1% | 9.0% |
| Interquartile 75% (IQ3) | 12.7% | 20.9% |
| Interquartile Range (IQR) | 4.6% | 11.9% |
| Standard Deviation (Sample) | 11.6% | 10.9% |
| Standard Deviation (Population) | 11.5% | 10.7% |
Similar Demographics by Receiving Food Stamps
Demographics Similar to Poles by Receiving Food Stamps
In terms of receiving food stamps, the demographic groups most similar to Poles are Laotian (10.0%, a difference of 0.080%), South African (10.0%, a difference of 0.12%), Immigrants from England (10.0%, a difference of 0.14%), Immigrants from North Macedonia (10.0%, a difference of 0.16%), and Immigrants from Croatia (10.0%, a difference of 0.25%).
| Demographics | Rating | Rank | Receiving Food Stamps |
| Macedonians | 98.9 /100 | #73 | Exceptional 9.9% |
| New Zealanders | 98.8 /100 | #74 | Exceptional 9.9% |
| Immigrants | Zimbabwe | 98.7 /100 | #75 | Exceptional 9.9% |
| Immigrants | Croatia | 98.7 /100 | #76 | Exceptional 10.0% |
| Immigrants | North Macedonia | 98.7 /100 | #77 | Exceptional 10.0% |
| South Africans | 98.7 /100 | #78 | Exceptional 10.0% |
| Laotians | 98.7 /100 | #79 | Exceptional 10.0% |
| Poles | 98.6 /100 | #80 | Exceptional 10.0% |
| Immigrants | England | 98.6 /100 | #81 | Exceptional 10.0% |
| Austrians | 98.6 /100 | #82 | Exceptional 10.0% |
| Dutch | 98.6 /100 | #83 | Exceptional 10.0% |
| Immigrants | Israel | 98.5 /100 | #84 | Exceptional 10.0% |
| Immigrants | Romania | 98.5 /100 | #85 | Exceptional 10.0% |
| Immigrants | Norway | 98.4 /100 | #86 | Exceptional 10.0% |
| Egyptians | 98.4 /100 | #87 | Exceptional 10.0% |
Demographics Similar to Immigrants from West Indies by Receiving Food Stamps
In terms of receiving food stamps, the demographic groups most similar to Immigrants from West Indies are Nicaraguan (16.1%, a difference of 0.090%), West Indian (16.3%, a difference of 0.77%), Trinidadian and Tobagonian (16.0%, a difference of 0.94%), Immigrants from Bangladesh (15.9%, a difference of 1.4%), and Immigrants from the Azores (16.4%, a difference of 1.7%).
| Demographics | Rating | Rank | Receiving Food Stamps |
| Immigrants | Honduras | 0.0 /100 | #295 | Tragic 15.7% |
| Tsimshian | 0.0 /100 | #296 | Tragic 15.7% |
| Immigrants | Bahamas | 0.0 /100 | #297 | Tragic 15.8% |
| Immigrants | Trinidad and Tobago | 0.0 /100 | #298 | Tragic 15.8% |
| Hispanics or Latinos | 0.0 /100 | #299 | Tragic 15.8% |
| Immigrants | Bangladesh | 0.0 /100 | #300 | Tragic 15.9% |
| Trinidadians and Tobagonians | 0.0 /100 | #301 | Tragic 16.0% |
| Immigrants | West Indies | 0.0 /100 | #302 | Tragic 16.1% |
| Nicaraguans | 0.0 /100 | #303 | Tragic 16.1% |
| West Indians | 0.0 /100 | #304 | Tragic 16.3% |
| Immigrants | Azores | 0.0 /100 | #305 | Tragic 16.4% |
| Jamaicans | 0.0 /100 | #306 | Tragic 16.4% |
| Houma | 0.0 /100 | #307 | Tragic 16.5% |
| Barbadians | 0.0 /100 | #308 | Tragic 16.5% |
| U.S. Virgin Islanders | 0.0 /100 | #309 | Tragic 16.5% |