Polish vs Immigrants from Eastern Europe Receiving Food Stamps
COMPARE
Polish
Immigrants from Eastern Europe
Receiving Food Stamps
Receiving Food Stamps Comparison
Poles
Immigrants from Eastern Europe
10.0%
RECEIVING FOOD STAMPS
98.6/ 100
METRIC RATING
80th/ 347
METRIC RANK
10.8%
RECEIVING FOOD STAMPS
89.8/ 100
METRIC RATING
137th/ 347
METRIC RANK
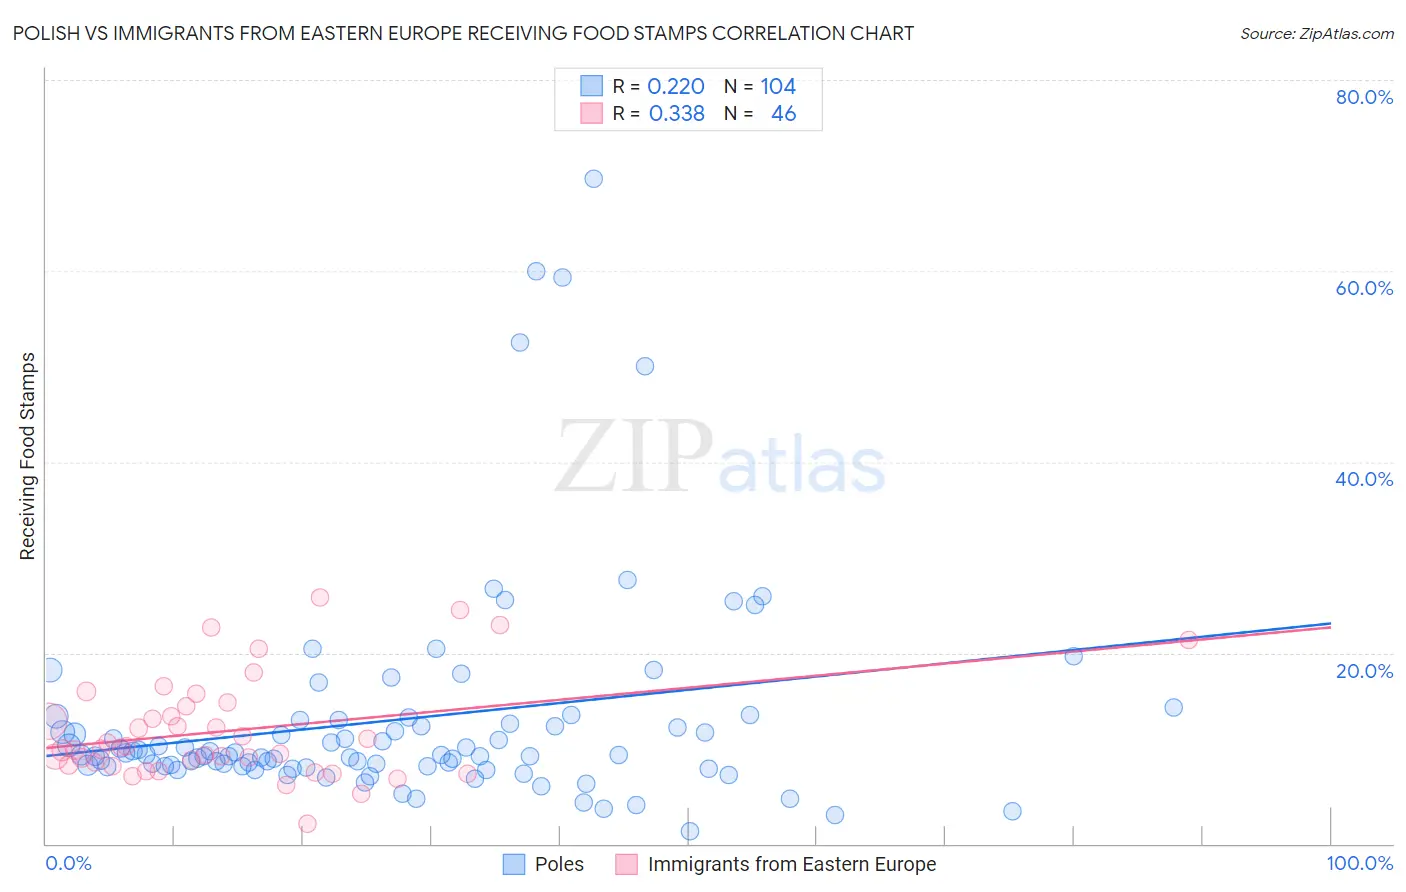
Polish vs Immigrants from Eastern Europe Receiving Food Stamps Correlation Chart
The statistical analysis conducted on geographies consisting of 556,985,146 people shows a weak positive correlation between the proportion of Poles and percentage of population receiving government assistance and/or food stamps in the United States with a correlation coefficient (R) of 0.220 and weighted average of 10.0%. Similarly, the statistical analysis conducted on geographies consisting of 473,642,116 people shows a mild positive correlation between the proportion of Immigrants from Eastern Europe and percentage of population receiving government assistance and/or food stamps in the United States with a correlation coefficient (R) of 0.338 and weighted average of 10.8%, a difference of 8.7%.
Receiving Food Stamps Correlation Summary
| Measurement | Polish | Immigrants from Eastern Europe |
| Minimum | 1.3% | 2.1% |
| Maximum | 69.7% | 25.8% |
| Range | 68.4% | 23.7% |
| Mean | 13.0% | 11.9% |
| Median | 9.3% | 10.0% |
| Interquartile 25% (IQ1) | 8.1% | 8.3% |
| Interquartile 75% (IQ3) | 12.7% | 14.4% |
| Interquartile Range (IQR) | 4.6% | 6.1% |
| Standard Deviation (Sample) | 11.6% | 5.4% |
| Standard Deviation (Population) | 11.5% | 5.3% |
Similar Demographics by Receiving Food Stamps
Demographics Similar to Poles by Receiving Food Stamps
In terms of receiving food stamps, the demographic groups most similar to Poles are Laotian (10.0%, a difference of 0.080%), South African (10.0%, a difference of 0.12%), Immigrants from England (10.0%, a difference of 0.14%), Immigrants from North Macedonia (10.0%, a difference of 0.16%), and Immigrants from Croatia (10.0%, a difference of 0.25%).
| Demographics | Rating | Rank | Receiving Food Stamps |
| Macedonians | 98.9 /100 | #73 | Exceptional 9.9% |
| New Zealanders | 98.8 /100 | #74 | Exceptional 9.9% |
| Immigrants | Zimbabwe | 98.7 /100 | #75 | Exceptional 9.9% |
| Immigrants | Croatia | 98.7 /100 | #76 | Exceptional 10.0% |
| Immigrants | North Macedonia | 98.7 /100 | #77 | Exceptional 10.0% |
| South Africans | 98.7 /100 | #78 | Exceptional 10.0% |
| Laotians | 98.7 /100 | #79 | Exceptional 10.0% |
| Poles | 98.6 /100 | #80 | Exceptional 10.0% |
| Immigrants | England | 98.6 /100 | #81 | Exceptional 10.0% |
| Austrians | 98.6 /100 | #82 | Exceptional 10.0% |
| Dutch | 98.6 /100 | #83 | Exceptional 10.0% |
| Immigrants | Israel | 98.5 /100 | #84 | Exceptional 10.0% |
| Immigrants | Romania | 98.5 /100 | #85 | Exceptional 10.0% |
| Immigrants | Norway | 98.4 /100 | #86 | Exceptional 10.0% |
| Egyptians | 98.4 /100 | #87 | Exceptional 10.0% |
Demographics Similar to Immigrants from Eastern Europe by Receiving Food Stamps
In terms of receiving food stamps, the demographic groups most similar to Immigrants from Eastern Europe are Slovak (10.8%, a difference of 0.020%), Argentinean (10.8%, a difference of 0.19%), Immigrants from Brazil (10.8%, a difference of 0.21%), Immigrants from Russia (10.8%, a difference of 0.51%), and Immigrants from Moldova (10.9%, a difference of 0.51%).
| Demographics | Rating | Rank | Receiving Food Stamps |
| Israelis | 92.4 /100 | #130 | Exceptional 10.7% |
| French | 92.3 /100 | #131 | Exceptional 10.7% |
| Immigrants | Germany | 92.0 /100 | #132 | Exceptional 10.7% |
| Immigrants | Russia | 90.9 /100 | #133 | Exceptional 10.8% |
| Immigrants | Brazil | 90.3 /100 | #134 | Exceptional 10.8% |
| Argentineans | 90.2 /100 | #135 | Exceptional 10.8% |
| Slovaks | 89.8 /100 | #136 | Excellent 10.8% |
| Immigrants | Eastern Europe | 89.8 /100 | #137 | Excellent 10.8% |
| Immigrants | Moldova | 88.5 /100 | #138 | Excellent 10.9% |
| Hmong | 88.4 /100 | #139 | Excellent 10.9% |
| Celtics | 87.8 /100 | #140 | Excellent 10.9% |
| Immigrants | Vietnam | 86.7 /100 | #141 | Excellent 11.0% |
| Chileans | 86.2 /100 | #142 | Excellent 11.0% |
| Immigrants | Northern Africa | 86.0 /100 | #143 | Excellent 11.0% |
| Syrians | 85.5 /100 | #144 | Excellent 11.0% |