Polish vs Cajun Receiving Food Stamps
COMPARE
Polish
Cajun
Receiving Food Stamps
Receiving Food Stamps Comparison
Poles
Cajuns
10.0%
RECEIVING FOOD STAMPS
98.6/ 100
METRIC RATING
80th/ 347
METRIC RANK
13.7%
RECEIVING FOOD STAMPS
0.9/ 100
METRIC RATING
244th/ 347
METRIC RANK
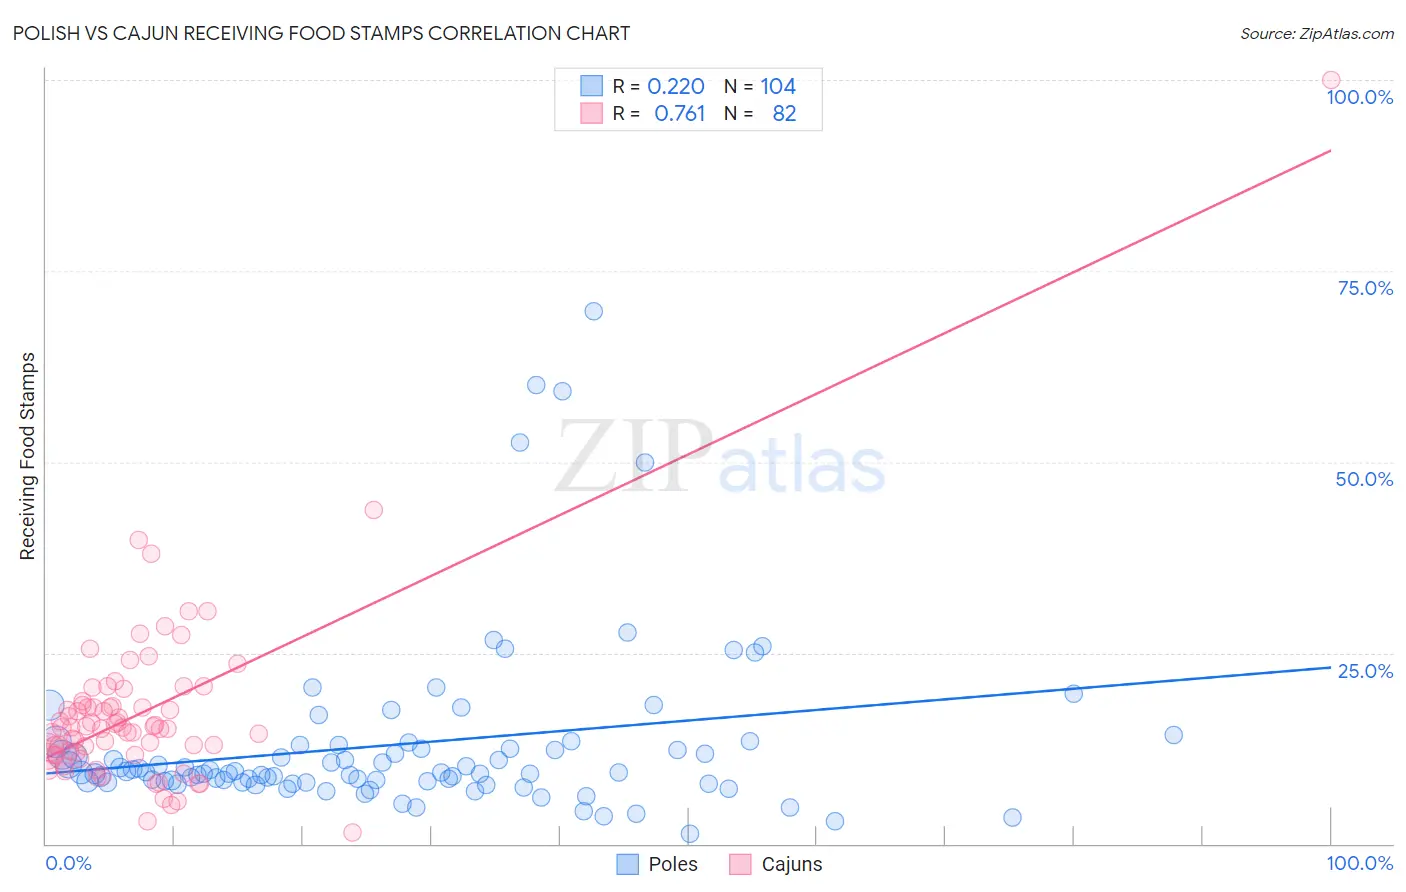
Polish vs Cajun Receiving Food Stamps Correlation Chart
The statistical analysis conducted on geographies consisting of 556,985,146 people shows a weak positive correlation between the proportion of Poles and percentage of population receiving government assistance and/or food stamps in the United States with a correlation coefficient (R) of 0.220 and weighted average of 10.0%. Similarly, the statistical analysis conducted on geographies consisting of 149,551,160 people shows a strong positive correlation between the proportion of Cajuns and percentage of population receiving government assistance and/or food stamps in the United States with a correlation coefficient (R) of 0.761 and weighted average of 13.7%, a difference of 37.2%.
Receiving Food Stamps Correlation Summary
| Measurement | Polish | Cajun |
| Minimum | 1.3% | 1.4% |
| Maximum | 69.7% | 100.0% |
| Range | 68.4% | 98.6% |
| Mean | 13.0% | 17.2% |
| Median | 9.3% | 15.2% |
| Interquartile 25% (IQ1) | 8.1% | 12.0% |
| Interquartile 75% (IQ3) | 12.7% | 18.2% |
| Interquartile Range (IQR) | 4.6% | 6.3% |
| Standard Deviation (Sample) | 11.6% | 11.9% |
| Standard Deviation (Population) | 11.5% | 11.9% |
Similar Demographics by Receiving Food Stamps
Demographics Similar to Poles by Receiving Food Stamps
In terms of receiving food stamps, the demographic groups most similar to Poles are Laotian (10.0%, a difference of 0.080%), South African (10.0%, a difference of 0.12%), Immigrants from England (10.0%, a difference of 0.14%), Immigrants from North Macedonia (10.0%, a difference of 0.16%), and Immigrants from Croatia (10.0%, a difference of 0.25%).
| Demographics | Rating | Rank | Receiving Food Stamps |
| Macedonians | 98.9 /100 | #73 | Exceptional 9.9% |
| New Zealanders | 98.8 /100 | #74 | Exceptional 9.9% |
| Immigrants | Zimbabwe | 98.7 /100 | #75 | Exceptional 9.9% |
| Immigrants | Croatia | 98.7 /100 | #76 | Exceptional 10.0% |
| Immigrants | North Macedonia | 98.7 /100 | #77 | Exceptional 10.0% |
| South Africans | 98.7 /100 | #78 | Exceptional 10.0% |
| Laotians | 98.7 /100 | #79 | Exceptional 10.0% |
| Poles | 98.6 /100 | #80 | Exceptional 10.0% |
| Immigrants | England | 98.6 /100 | #81 | Exceptional 10.0% |
| Austrians | 98.6 /100 | #82 | Exceptional 10.0% |
| Dutch | 98.6 /100 | #83 | Exceptional 10.0% |
| Immigrants | Israel | 98.5 /100 | #84 | Exceptional 10.0% |
| Immigrants | Romania | 98.5 /100 | #85 | Exceptional 10.0% |
| Immigrants | Norway | 98.4 /100 | #86 | Exceptional 10.0% |
| Egyptians | 98.4 /100 | #87 | Exceptional 10.0% |
Demographics Similar to Cajuns by Receiving Food Stamps
In terms of receiving food stamps, the demographic groups most similar to Cajuns are Immigrants from Somalia (13.7%, a difference of 0.040%), Somali (13.7%, a difference of 0.16%), Cree (13.7%, a difference of 0.28%), Immigrants from Panama (13.6%, a difference of 0.35%), and Choctaw (13.6%, a difference of 0.54%).
| Demographics | Rating | Rank | Receiving Food Stamps |
| Immigrants | El Salvador | 1.5 /100 | #237 | Tragic 13.5% |
| French American Indians | 1.4 /100 | #238 | Tragic 13.5% |
| Immigrants | Micronesia | 1.3 /100 | #239 | Tragic 13.5% |
| Iroquois | 1.2 /100 | #240 | Tragic 13.5% |
| Choctaw | 1.0 /100 | #241 | Tragic 13.6% |
| Immigrants | Panama | 1.0 /100 | #242 | Tragic 13.6% |
| Somalis | 0.9 /100 | #243 | Tragic 13.7% |
| Cajuns | 0.9 /100 | #244 | Tragic 13.7% |
| Immigrants | Somalia | 0.9 /100 | #245 | Tragic 13.7% |
| Cree | 0.8 /100 | #246 | Tragic 13.7% |
| Mexican American Indians | 0.7 /100 | #247 | Tragic 13.8% |
| Immigrants | Laos | 0.7 /100 | #248 | Tragic 13.8% |
| Indonesians | 0.6 /100 | #249 | Tragic 13.9% |
| Immigrants | Cambodia | 0.5 /100 | #250 | Tragic 13.9% |
| Yaqui | 0.5 /100 | #251 | Tragic 13.9% |