Pima vs Immigrants from Kenya Female Poverty
COMPARE
Pima
Immigrants from Kenya
Female Poverty
Female Poverty Comparison
Pima
Immigrants from Kenya
23.6%
FEMALE POVERTY
0.0/ 100
METRIC RATING
344th/ 347
METRIC RANK
13.9%
FEMALE POVERTY
21.1/ 100
METRIC RATING
201st/ 347
METRIC RANK
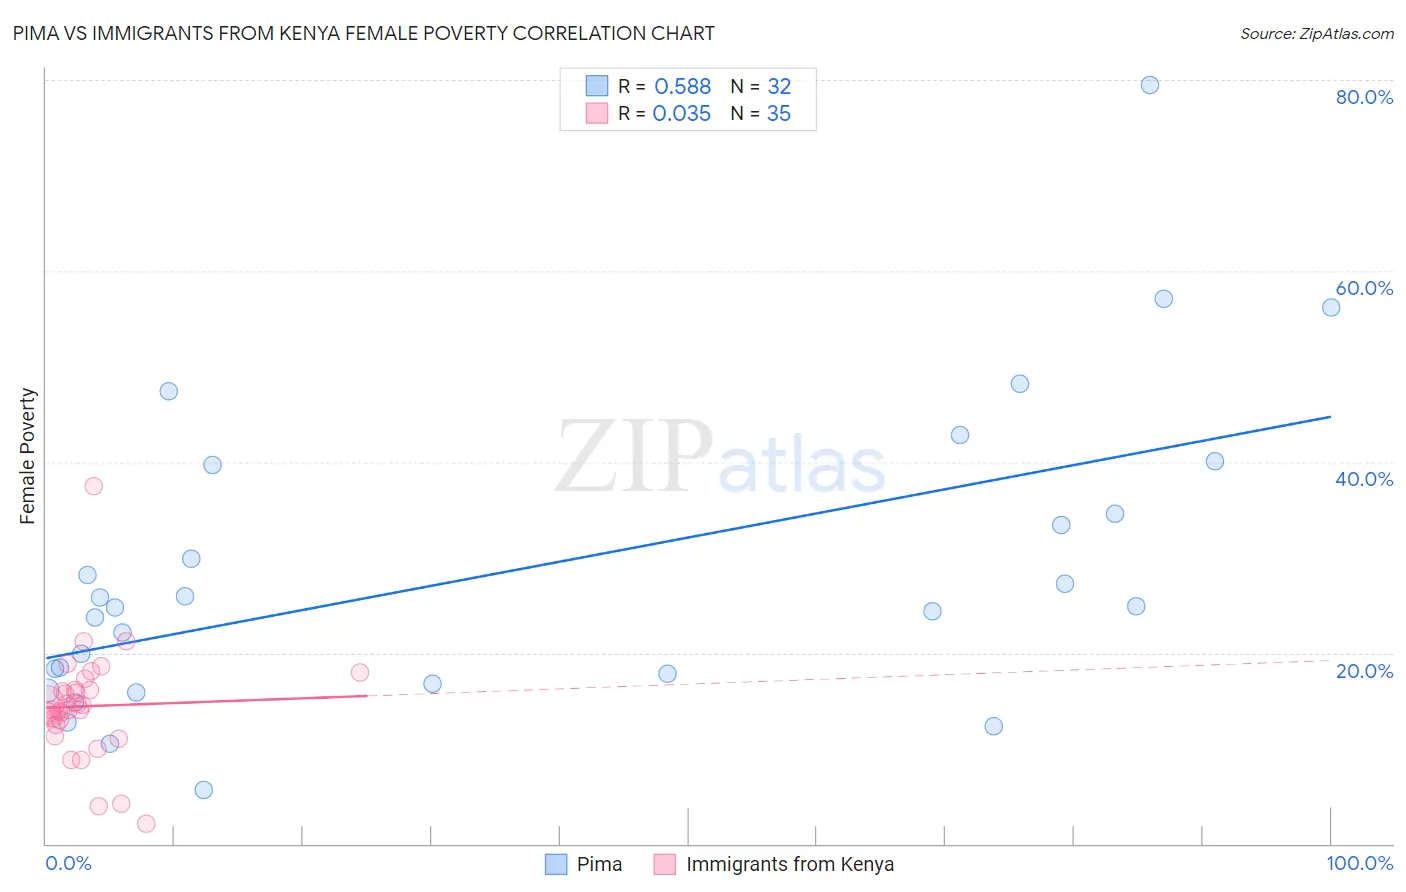
Pima vs Immigrants from Kenya Female Poverty Correlation Chart
The statistical analysis conducted on geographies consisting of 61,538,212 people shows a substantial positive correlation between the proportion of Pima and poverty level among females in the United States with a correlation coefficient (R) of 0.588 and weighted average of 23.6%. Similarly, the statistical analysis conducted on geographies consisting of 217,949,834 people shows no correlation between the proportion of Immigrants from Kenya and poverty level among females in the United States with a correlation coefficient (R) of 0.035 and weighted average of 13.9%, a difference of 70.1%.
Female Poverty Correlation Summary
| Measurement | Pima | Immigrants from Kenya |
| Minimum | 5.7% | 2.1% |
| Maximum | 79.5% | 37.4% |
| Range | 73.8% | 35.3% |
| Mean | 28.6% | 14.4% |
| Median | 24.8% | 14.1% |
| Interquartile 25% (IQ1) | 17.3% | 12.5% |
| Interquartile 75% (IQ3) | 37.2% | 16.2% |
| Interquartile Range (IQR) | 19.9% | 3.7% |
| Standard Deviation (Sample) | 16.0% | 5.9% |
| Standard Deviation (Population) | 15.8% | 5.8% |
Similar Demographics by Female Poverty
Demographics Similar to Pima by Female Poverty
In terms of female poverty, the demographic groups most similar to Pima are Lumbee (23.5%, a difference of 0.31%), Navajo (23.9%, a difference of 1.3%), Immigrants from Yemen (22.8%, a difference of 3.3%), Crow (22.1%, a difference of 6.5%), and Puerto Rican (25.2%, a difference of 6.8%).
| Demographics | Rating | Rank | Female Poverty |
| Immigrants | Dominican Republic | 0.0 /100 | #333 | Tragic 19.3% |
| Houma | 0.0 /100 | #334 | Tragic 20.0% |
| Cheyenne | 0.0 /100 | #335 | Tragic 20.2% |
| Pueblo | 0.0 /100 | #336 | Tragic 20.7% |
| Yuman | 0.0 /100 | #337 | Tragic 20.8% |
| Sioux | 0.0 /100 | #338 | Tragic 20.9% |
| Hopi | 0.0 /100 | #339 | Tragic 21.0% |
| Yup'ik | 0.0 /100 | #340 | Tragic 21.5% |
| Crow | 0.0 /100 | #341 | Tragic 22.1% |
| Immigrants | Yemen | 0.0 /100 | #342 | Tragic 22.8% |
| Lumbee | 0.0 /100 | #343 | Tragic 23.5% |
| Pima | 0.0 /100 | #344 | Tragic 23.6% |
| Navajo | 0.0 /100 | #345 | Tragic 23.9% |
| Puerto Ricans | 0.0 /100 | #346 | Tragic 25.2% |
| Tohono O'odham | 0.0 /100 | #347 | Tragic 25.9% |
Demographics Similar to Immigrants from Kenya by Female Poverty
In terms of female poverty, the demographic groups most similar to Immigrants from Kenya are Hmong (13.9%, a difference of 0.010%), Spanish (13.9%, a difference of 0.040%), Immigrants from Western Asia (13.9%, a difference of 0.060%), Spaniard (13.9%, a difference of 0.33%), and Immigrants from Lebanon (13.8%, a difference of 0.59%).
| Demographics | Rating | Rank | Female Poverty |
| Delaware | 31.1 /100 | #194 | Fair 13.7% |
| Immigrants | South America | 30.6 /100 | #195 | Fair 13.7% |
| South American Indians | 28.9 /100 | #196 | Fair 13.7% |
| Arabs | 28.6 /100 | #197 | Fair 13.7% |
| Immigrants | Uganda | 28.5 /100 | #198 | Fair 13.7% |
| Immigrants | Lebanon | 25.6 /100 | #199 | Fair 13.8% |
| Spanish | 21.4 /100 | #200 | Fair 13.9% |
| Immigrants | Kenya | 21.1 /100 | #201 | Fair 13.9% |
| Hmong | 21.1 /100 | #202 | Fair 13.9% |
| Immigrants | Western Asia | 20.7 /100 | #203 | Fair 13.9% |
| Spaniards | 18.9 /100 | #204 | Poor 13.9% |
| Ugandans | 15.4 /100 | #205 | Poor 14.0% |
| Immigrants | Uruguay | 14.0 /100 | #206 | Poor 14.0% |
| Immigrants | Eastern Africa | 9.0 /100 | #207 | Tragic 14.2% |
| Immigrants | Azores | 7.9 /100 | #208 | Tragic 14.2% |