Estonian vs Immigrants from Kenya Female Poverty
COMPARE
Estonian
Immigrants from Kenya
Female Poverty
Female Poverty Comparison
Estonians
Immigrants from Kenya
12.1%
FEMALE POVERTY
98.3/ 100
METRIC RATING
56th/ 347
METRIC RANK
13.9%
FEMALE POVERTY
21.1/ 100
METRIC RATING
201st/ 347
METRIC RANK
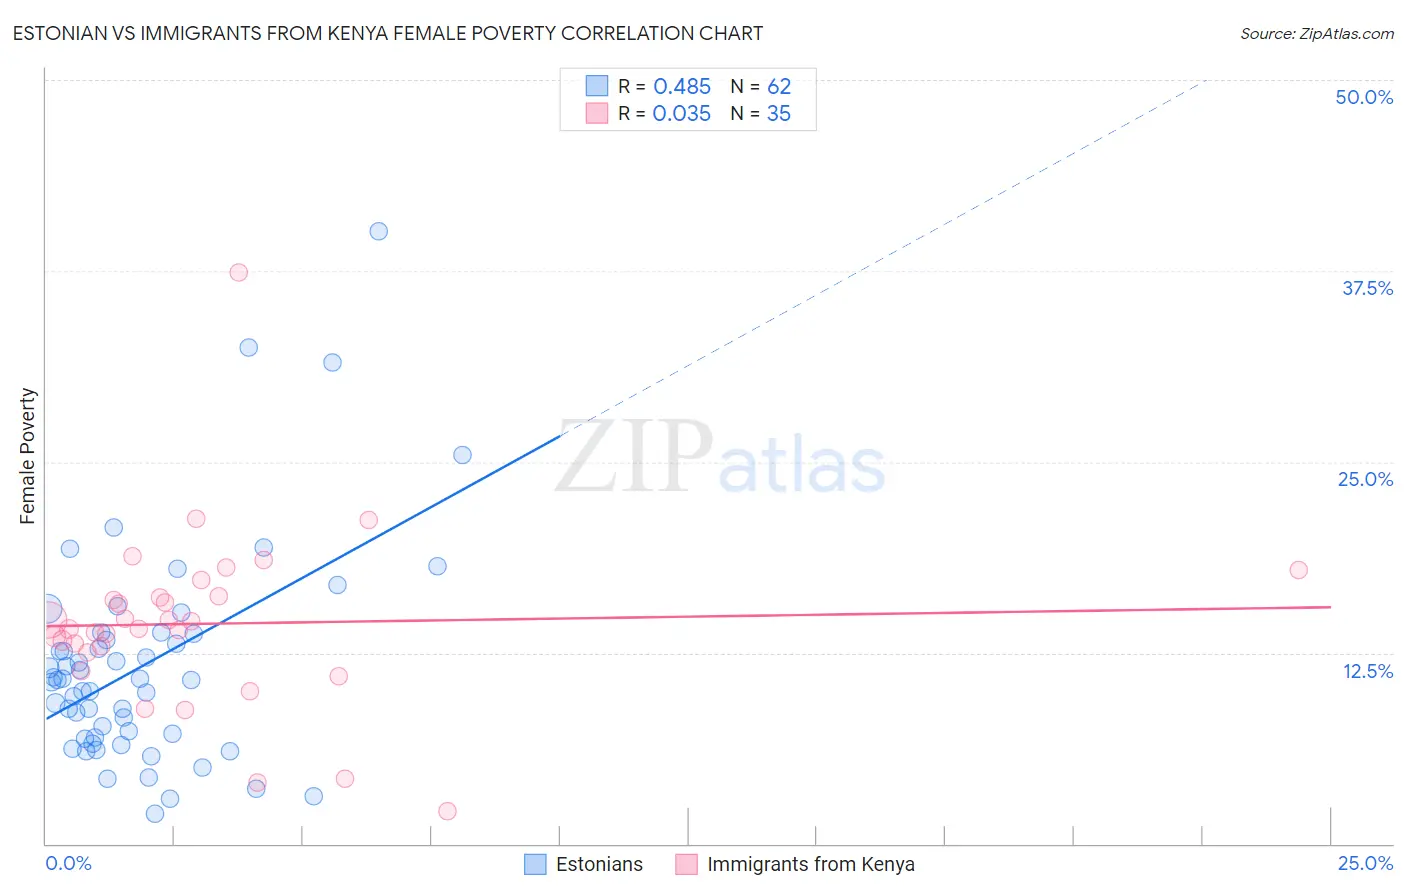
Estonian vs Immigrants from Kenya Female Poverty Correlation Chart
The statistical analysis conducted on geographies consisting of 123,486,564 people shows a moderate positive correlation between the proportion of Estonians and poverty level among females in the United States with a correlation coefficient (R) of 0.485 and weighted average of 12.1%. Similarly, the statistical analysis conducted on geographies consisting of 217,949,834 people shows no correlation between the proportion of Immigrants from Kenya and poverty level among females in the United States with a correlation coefficient (R) of 0.035 and weighted average of 13.9%, a difference of 14.4%.
Female Poverty Correlation Summary
| Measurement | Estonian | Immigrants from Kenya |
| Minimum | 1.9% | 2.1% |
| Maximum | 40.1% | 37.4% |
| Range | 38.2% | 35.3% |
| Mean | 11.7% | 14.4% |
| Median | 10.7% | 14.1% |
| Interquartile 25% (IQ1) | 7.0% | 12.5% |
| Interquartile 75% (IQ3) | 13.8% | 16.2% |
| Interquartile Range (IQR) | 6.8% | 3.7% |
| Standard Deviation (Sample) | 7.1% | 5.9% |
| Standard Deviation (Population) | 7.0% | 5.8% |
Similar Demographics by Female Poverty
Demographics Similar to Estonians by Female Poverty
In terms of female poverty, the demographic groups most similar to Estonians are Immigrants from Serbia (12.1%, a difference of 0.060%), Scandinavian (12.1%, a difference of 0.14%), Immigrants from Europe (12.1%, a difference of 0.15%), Immigrants from Sri Lanka (12.1%, a difference of 0.25%), and Immigrants from Australia (12.2%, a difference of 0.39%).
| Demographics | Rating | Rank | Female Poverty |
| Immigrants | Romania | 99.0 /100 | #49 | Exceptional 12.0% |
| Slovenes | 98.9 /100 | #50 | Exceptional 12.0% |
| Immigrants | Bulgaria | 98.9 /100 | #51 | Exceptional 12.0% |
| Immigrants | Croatia | 98.7 /100 | #52 | Exceptional 12.0% |
| Immigrants | Austria | 98.7 /100 | #53 | Exceptional 12.0% |
| Immigrants | Philippines | 98.7 /100 | #54 | Exceptional 12.1% |
| Immigrants | Sri Lanka | 98.5 /100 | #55 | Exceptional 12.1% |
| Estonians | 98.3 /100 | #56 | Exceptional 12.1% |
| Immigrants | Serbia | 98.3 /100 | #57 | Exceptional 12.1% |
| Scandinavians | 98.2 /100 | #58 | Exceptional 12.1% |
| Immigrants | Europe | 98.2 /100 | #59 | Exceptional 12.1% |
| Immigrants | Australia | 98.1 /100 | #60 | Exceptional 12.2% |
| Immigrants | Asia | 98.1 /100 | #61 | Exceptional 12.2% |
| Immigrants | Italy | 98.0 /100 | #62 | Exceptional 12.2% |
| Ukrainians | 98.0 /100 | #63 | Exceptional 12.2% |
Demographics Similar to Immigrants from Kenya by Female Poverty
In terms of female poverty, the demographic groups most similar to Immigrants from Kenya are Hmong (13.9%, a difference of 0.010%), Spanish (13.9%, a difference of 0.040%), Immigrants from Western Asia (13.9%, a difference of 0.060%), Spaniard (13.9%, a difference of 0.33%), and Immigrants from Lebanon (13.8%, a difference of 0.59%).
| Demographics | Rating | Rank | Female Poverty |
| Delaware | 31.1 /100 | #194 | Fair 13.7% |
| Immigrants | South America | 30.6 /100 | #195 | Fair 13.7% |
| South American Indians | 28.9 /100 | #196 | Fair 13.7% |
| Arabs | 28.6 /100 | #197 | Fair 13.7% |
| Immigrants | Uganda | 28.5 /100 | #198 | Fair 13.7% |
| Immigrants | Lebanon | 25.6 /100 | #199 | Fair 13.8% |
| Spanish | 21.4 /100 | #200 | Fair 13.9% |
| Immigrants | Kenya | 21.1 /100 | #201 | Fair 13.9% |
| Hmong | 21.1 /100 | #202 | Fair 13.9% |
| Immigrants | Western Asia | 20.7 /100 | #203 | Fair 13.9% |
| Spaniards | 18.9 /100 | #204 | Poor 13.9% |
| Ugandans | 15.4 /100 | #205 | Poor 14.0% |
| Immigrants | Uruguay | 14.0 /100 | #206 | Poor 14.0% |
| Immigrants | Eastern Africa | 9.0 /100 | #207 | Tragic 14.2% |
| Immigrants | Azores | 7.9 /100 | #208 | Tragic 14.2% |