Paraguayan vs Chinese Child Poverty Among Girls Under 16
COMPARE
Paraguayan
Chinese
Child Poverty Among Girls Under 16
Child Poverty Among Girls Under 16 Comparison
Paraguayans
Chinese
15.0%
CHILD POVERTY AMONG GIRLS UNDER 16
95.7/ 100
METRIC RATING
100th/ 347
METRIC RANK
12.3%
CHILD POVERTY AMONG GIRLS UNDER 16
100.0/ 100
METRIC RATING
7th/ 347
METRIC RANK
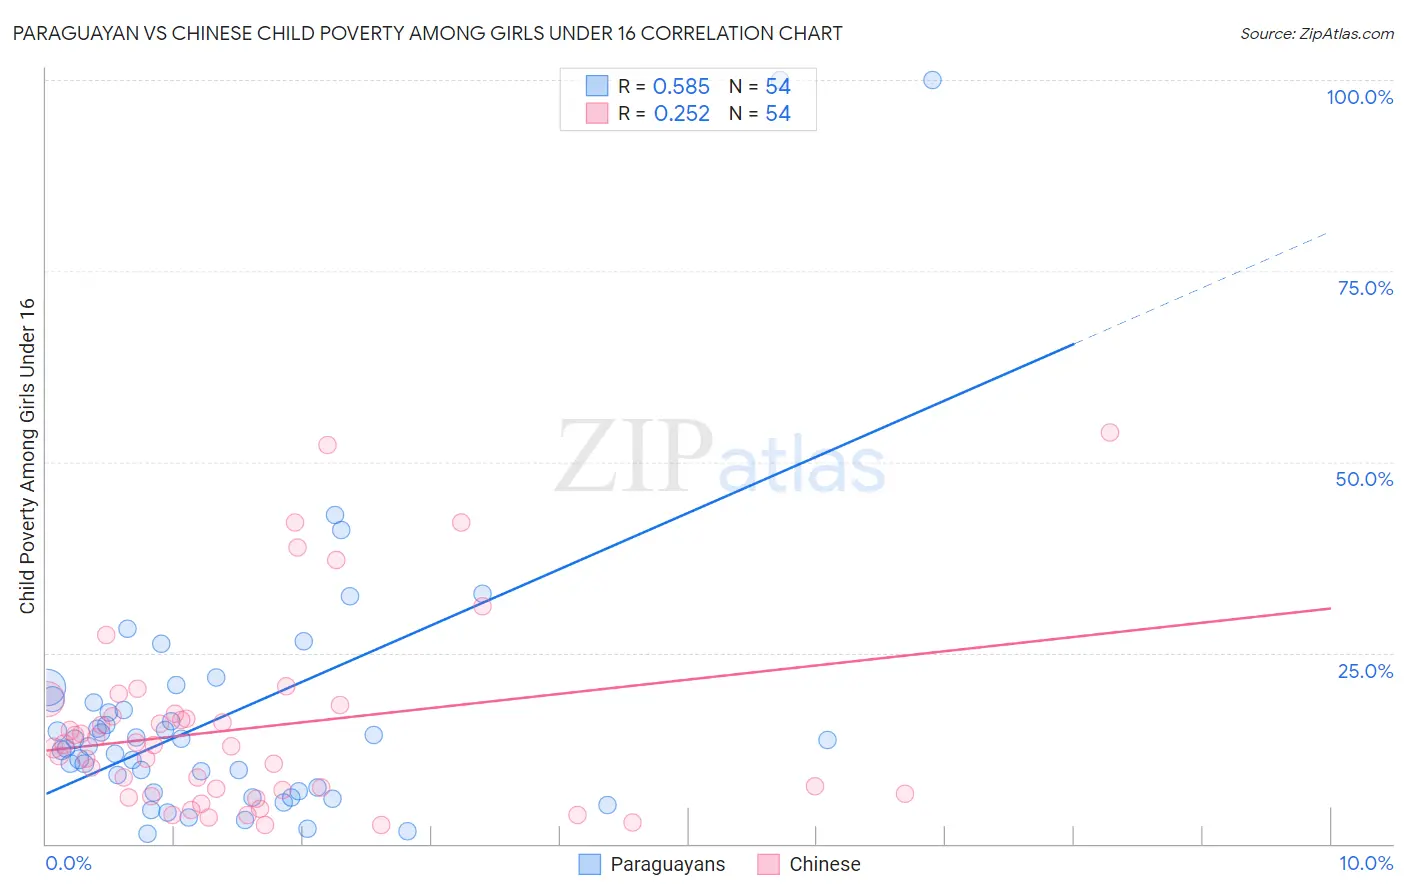
Paraguayan vs Chinese Child Poverty Among Girls Under 16 Correlation Chart
The statistical analysis conducted on geographies consisting of 94,658,687 people shows a substantial positive correlation between the proportion of Paraguayans and poverty level among girls under the age of 16 in the United States with a correlation coefficient (R) of 0.585 and weighted average of 15.0%. Similarly, the statistical analysis conducted on geographies consisting of 64,581,051 people shows a weak positive correlation between the proportion of Chinese and poverty level among girls under the age of 16 in the United States with a correlation coefficient (R) of 0.252 and weighted average of 12.3%, a difference of 21.5%.
Child Poverty Among Girls Under 16 Correlation Summary
| Measurement | Paraguayan | Chinese |
| Minimum | 1.2% | 2.5% |
| Maximum | 100.0% | 53.8% |
| Range | 98.8% | 51.4% |
| Mean | 17.1% | 15.2% |
| Median | 13.2% | 12.8% |
| Interquartile 25% (IQ1) | 6.9% | 6.5% |
| Interquartile 75% (IQ3) | 18.5% | 17.1% |
| Interquartile Range (IQR) | 11.6% | 10.6% |
| Standard Deviation (Sample) | 18.8% | 12.3% |
| Standard Deviation (Population) | 18.6% | 12.2% |
Similar Demographics by Child Poverty Among Girls Under 16
Demographics Similar to Paraguayans by Child Poverty Among Girls Under 16
In terms of child poverty among girls under 16, the demographic groups most similar to Paraguayans are Immigrants from South Africa (15.0%, a difference of 0.030%), Immigrants from Egypt (15.0%, a difference of 0.040%), Immigrants from Malaysia (15.0%, a difference of 0.050%), British (15.0%, a difference of 0.070%), and Basque (15.0%, a difference of 0.20%).
| Demographics | Rating | Rank | Child Poverty Among Girls Under 16 |
| Immigrants | North America | 96.6 /100 | #93 | Exceptional 14.9% |
| Immigrants | Switzerland | 96.3 /100 | #94 | Exceptional 14.9% |
| Germans | 96.3 /100 | #95 | Exceptional 14.9% |
| Immigrants | France | 96.2 /100 | #96 | Exceptional 14.9% |
| Immigrants | Latvia | 96.1 /100 | #97 | Exceptional 14.9% |
| Basques | 95.9 /100 | #98 | Exceptional 15.0% |
| Immigrants | Egypt | 95.7 /100 | #99 | Exceptional 15.0% |
| Paraguayans | 95.7 /100 | #100 | Exceptional 15.0% |
| Immigrants | South Africa | 95.6 /100 | #101 | Exceptional 15.0% |
| Immigrants | Malaysia | 95.6 /100 | #102 | Exceptional 15.0% |
| British | 95.6 /100 | #103 | Exceptional 15.0% |
| Romanians | 95.3 /100 | #104 | Exceptional 15.0% |
| Immigrants | England | 95.1 /100 | #105 | Exceptional 15.1% |
| Chileans | 95.1 /100 | #106 | Exceptional 15.1% |
| Immigrants | Ukraine | 95.0 /100 | #107 | Exceptional 15.1% |
Demographics Similar to Chinese by Child Poverty Among Girls Under 16
In terms of child poverty among girls under 16, the demographic groups most similar to Chinese are Immigrants from Hong Kong (12.3%, a difference of 0.13%), Iranian (12.4%, a difference of 0.53%), Immigrants from Singapore (12.5%, a difference of 0.96%), Immigrants from Iran (12.6%, a difference of 1.9%), and Immigrants from South Central Asia (12.7%, a difference of 3.2%).
| Demographics | Rating | Rank | Child Poverty Among Girls Under 16 |
| Immigrants | India | 100.0 /100 | #1 | Exceptional 11.0% |
| Immigrants | Taiwan | 100.0 /100 | #2 | Exceptional 11.3% |
| Filipinos | 100.0 /100 | #3 | Exceptional 11.4% |
| Tsimshian | 100.0 /100 | #4 | Exceptional 11.5% |
| Thais | 100.0 /100 | #5 | Exceptional 11.8% |
| Immigrants | Hong Kong | 100.0 /100 | #6 | Exceptional 12.3% |
| Chinese | 100.0 /100 | #7 | Exceptional 12.3% |
| Iranians | 100.0 /100 | #8 | Exceptional 12.4% |
| Immigrants | Singapore | 100.0 /100 | #9 | Exceptional 12.5% |
| Immigrants | Iran | 100.0 /100 | #10 | Exceptional 12.6% |
| Immigrants | South Central Asia | 100.0 /100 | #11 | Exceptional 12.7% |
| Bhutanese | 100.0 /100 | #12 | Exceptional 12.7% |
| Immigrants | Ireland | 99.9 /100 | #13 | Exceptional 12.9% |
| Burmese | 99.9 /100 | #14 | Exceptional 13.0% |
| Okinawans | 99.9 /100 | #15 | Exceptional 13.0% |