Tohono O'odham vs Immigrants from Guyana Male Poverty
COMPARE
Tohono O'odham
Immigrants from Guyana
Male Poverty
Male Poverty Comparison
Tohono O'odham
Immigrants from Guyana
22.9%
MALE POVERTY
0.0/ 100
METRIC RATING
347th/ 347
METRIC RANK
13.2%
MALE POVERTY
0.1/ 100
METRIC RATING
266th/ 347
METRIC RANK
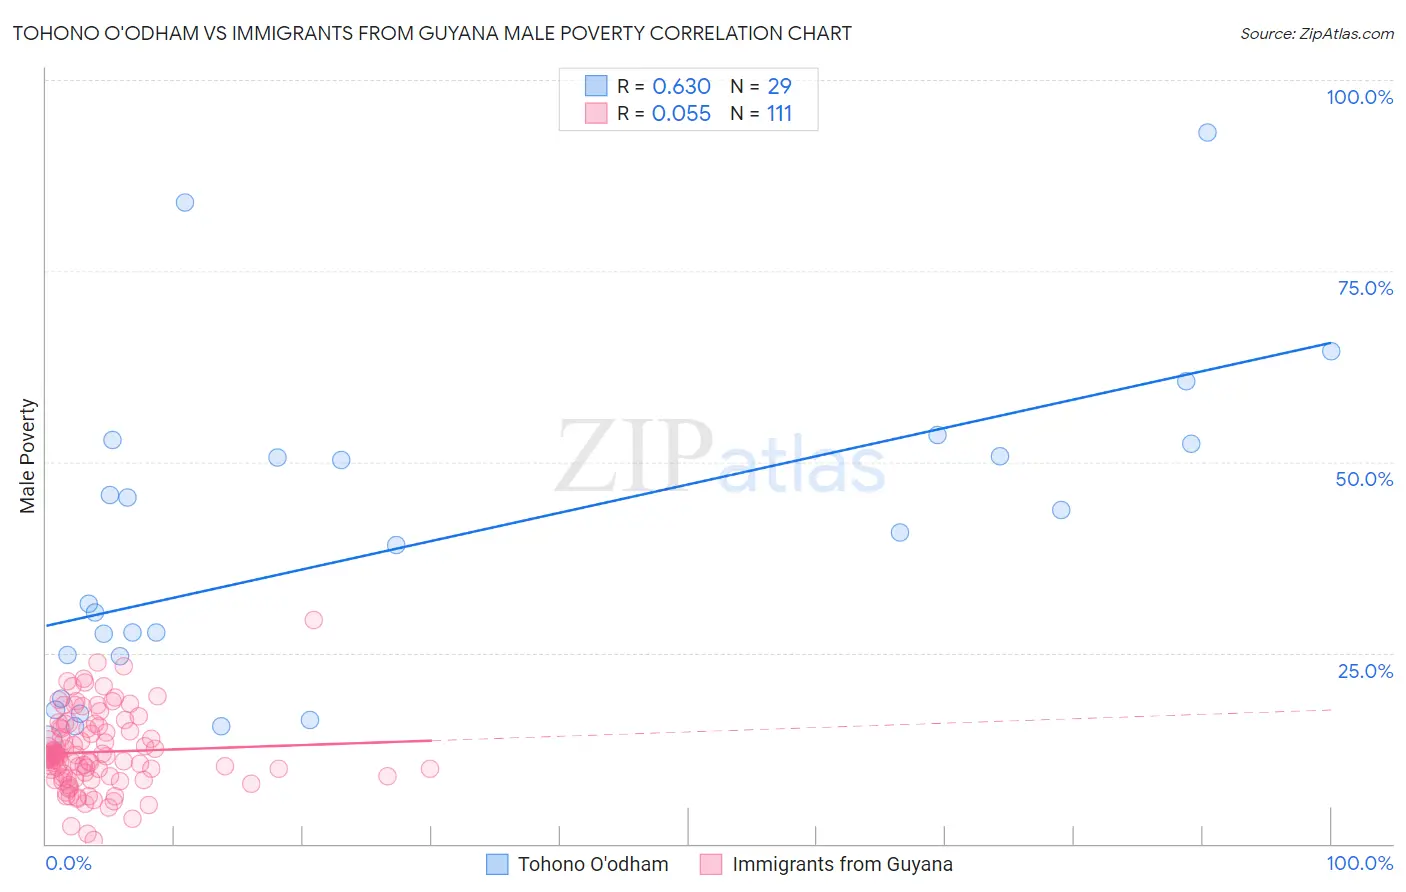
Tohono O'odham vs Immigrants from Guyana Male Poverty Correlation Chart
The statistical analysis conducted on geographies consisting of 58,718,302 people shows a significant positive correlation between the proportion of Tohono O'odham and poverty level among males in the United States with a correlation coefficient (R) of 0.630 and weighted average of 22.9%. Similarly, the statistical analysis conducted on geographies consisting of 183,559,274 people shows a slight positive correlation between the proportion of Immigrants from Guyana and poverty level among males in the United States with a correlation coefficient (R) of 0.055 and weighted average of 13.2%, a difference of 72.9%.
Male Poverty Correlation Summary
| Measurement | Tohono O'odham | Immigrants from Guyana |
| Minimum | 13.4% | 0.44% |
| Maximum | 93.1% | 29.2% |
| Range | 79.8% | 28.8% |
| Mean | 39.1% | 12.0% |
| Median | 39.0% | 11.4% |
| Interquartile 25% (IQ1) | 21.8% | 8.6% |
| Interquartile 75% (IQ3) | 51.5% | 15.1% |
| Interquartile Range (IQR) | 29.8% | 6.5% |
| Standard Deviation (Sample) | 20.5% | 5.0% |
| Standard Deviation (Population) | 20.1% | 5.0% |
Similar Demographics by Male Poverty
Demographics Similar to Tohono O'odham by Male Poverty
In terms of male poverty, the demographic groups most similar to Tohono O'odham are Navajo (22.3%, a difference of 2.6%), Puerto Rican (22.0%, a difference of 3.9%), Hopi (20.8%, a difference of 10.0%), Yup'ik (20.4%, a difference of 12.3%), and Pima (20.4%, a difference of 12.4%).
| Demographics | Rating | Rank | Male Poverty |
| Natives/Alaskans | 0.0 /100 | #333 | Tragic 16.9% |
| Cheyenne | 0.0 /100 | #334 | Tragic 17.6% |
| Apache | 0.0 /100 | #335 | Tragic 17.7% |
| Pueblo | 0.0 /100 | #336 | Tragic 18.5% |
| Sioux | 0.0 /100 | #337 | Tragic 18.7% |
| Crow | 0.0 /100 | #338 | Tragic 19.1% |
| Yuman | 0.0 /100 | #339 | Tragic 19.5% |
| Immigrants | Yemen | 0.0 /100 | #340 | Tragic 20.1% |
| Lumbee | 0.0 /100 | #341 | Tragic 20.2% |
| Pima | 0.0 /100 | #342 | Tragic 20.4% |
| Yup'ik | 0.0 /100 | #343 | Tragic 20.4% |
| Hopi | 0.0 /100 | #344 | Tragic 20.8% |
| Puerto Ricans | 0.0 /100 | #345 | Tragic 22.0% |
| Navajo | 0.0 /100 | #346 | Tragic 22.3% |
| Tohono O'odham | 0.0 /100 | #347 | Tragic 22.9% |
Demographics Similar to Immigrants from Guyana by Male Poverty
In terms of male poverty, the demographic groups most similar to Immigrants from Guyana are Immigrants from Jamaica (13.3%, a difference of 0.11%), Jamaican (13.2%, a difference of 0.14%), Subsaharan African (13.3%, a difference of 0.14%), Iroquois (13.2%, a difference of 0.16%), and Guyanese (13.3%, a difference of 0.36%).
| Demographics | Rating | Rank | Male Poverty |
| Cherokee | 0.1 /100 | #259 | Tragic 13.1% |
| Ottawa | 0.1 /100 | #260 | Tragic 13.1% |
| Trinidadians and Tobagonians | 0.1 /100 | #261 | Tragic 13.1% |
| Spanish American Indians | 0.1 /100 | #262 | Tragic 13.1% |
| Central Americans | 0.1 /100 | #263 | Tragic 13.2% |
| Iroquois | 0.1 /100 | #264 | Tragic 13.2% |
| Jamaicans | 0.1 /100 | #265 | Tragic 13.2% |
| Immigrants | Guyana | 0.1 /100 | #266 | Tragic 13.2% |
| Immigrants | Jamaica | 0.1 /100 | #267 | Tragic 13.3% |
| Sub-Saharan Africans | 0.1 /100 | #268 | Tragic 13.3% |
| Guyanese | 0.0 /100 | #269 | Tragic 13.3% |
| Cree | 0.0 /100 | #270 | Tragic 13.3% |
| Spanish Americans | 0.0 /100 | #271 | Tragic 13.4% |
| Immigrants | Bahamas | 0.0 /100 | #272 | Tragic 13.5% |
| Chickasaw | 0.0 /100 | #273 | Tragic 13.5% |