Norwegian vs Creek Single Male Poverty
COMPARE
Norwegian
Creek
Single Male Poverty
Single Male Poverty Comparison
Norwegians
Creek
12.9%
SINGLE MALE POVERTY
32.0/ 100
METRIC RATING
185th/ 347
METRIC RANK
16.8%
SINGLE MALE POVERTY
0.0/ 100
METRIC RATING
323rd/ 347
METRIC RANK
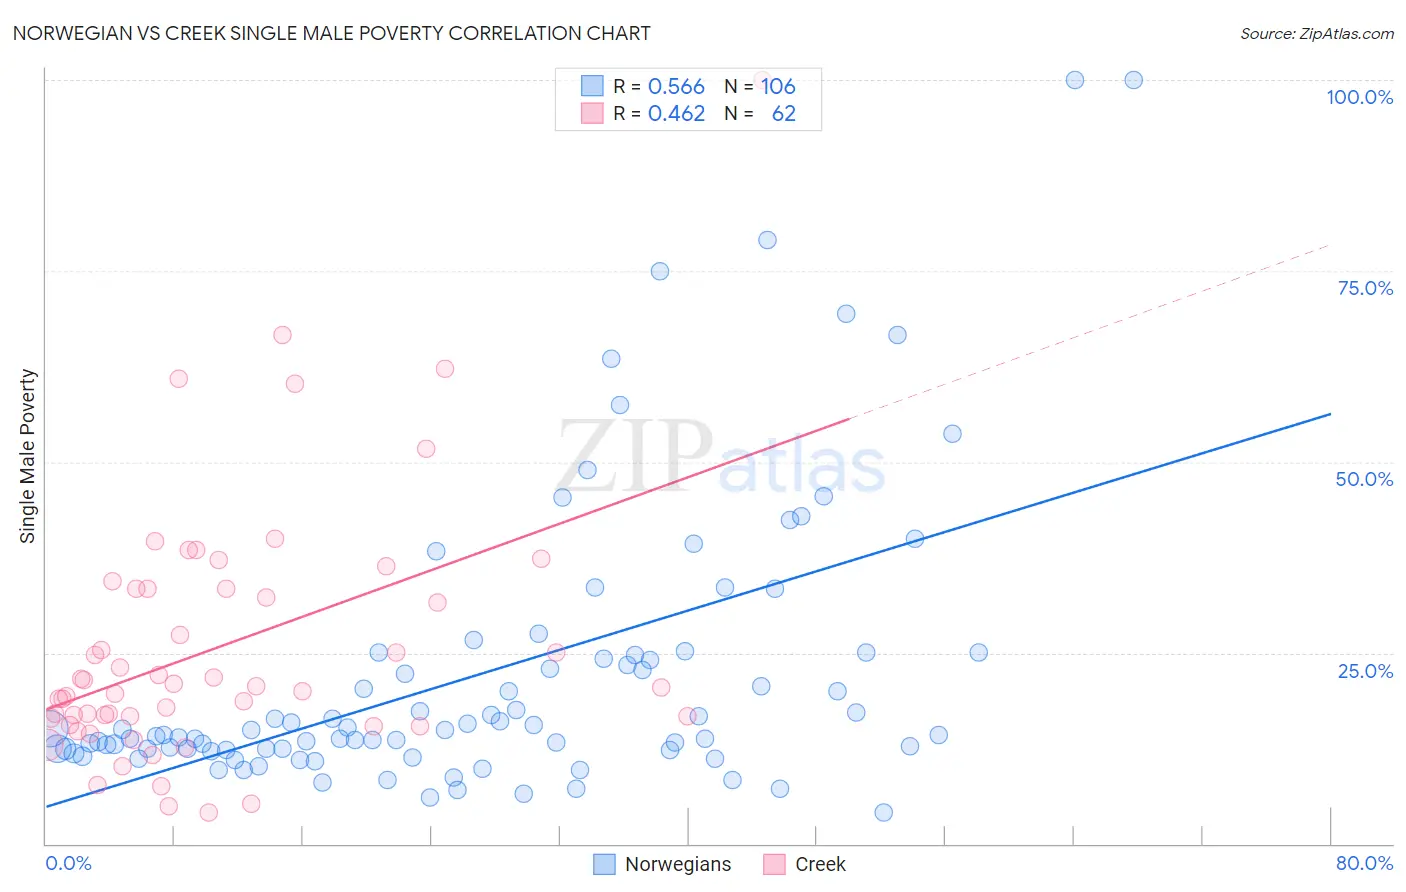
Norwegian vs Creek Single Male Poverty Correlation Chart
The statistical analysis conducted on geographies consisting of 445,954,160 people shows a substantial positive correlation between the proportion of Norwegians and poverty level among single males in the United States with a correlation coefficient (R) of 0.566 and weighted average of 12.9%. Similarly, the statistical analysis conducted on geographies consisting of 168,159,894 people shows a moderate positive correlation between the proportion of Creek and poverty level among single males in the United States with a correlation coefficient (R) of 0.462 and weighted average of 16.8%, a difference of 30.3%.
Single Male Poverty Correlation Summary
| Measurement | Norwegian | Creek |
| Minimum | 4.2% | 4.0% |
| Maximum | 100.0% | 100.0% |
| Range | 95.8% | 96.0% |
| Mean | 22.4% | 25.8% |
| Median | 14.6% | 20.6% |
| Interquartile 25% (IQ1) | 12.4% | 16.5% |
| Interquartile 75% (IQ3) | 24.7% | 33.3% |
| Interquartile Range (IQR) | 12.3% | 16.9% |
| Standard Deviation (Sample) | 18.9% | 17.0% |
| Standard Deviation (Population) | 18.8% | 16.9% |
Similar Demographics by Single Male Poverty
Demographics Similar to Norwegians by Single Male Poverty
In terms of single male poverty, the demographic groups most similar to Norwegians are Nigerian (12.9%, a difference of 0.0%), Immigrants from Kuwait (12.9%, a difference of 0.010%), Immigrants from Trinidad and Tobago (12.9%, a difference of 0.030%), Macedonian (12.9%, a difference of 0.030%), and Immigrants from West Indies (12.9%, a difference of 0.060%).
| Demographics | Rating | Rank | Single Male Poverty |
| Immigrants | Switzerland | 43.1 /100 | #178 | Average 12.8% |
| Israelis | 41.0 /100 | #179 | Average 12.9% |
| Immigrants | North America | 37.7 /100 | #180 | Fair 12.9% |
| Panamanians | 37.6 /100 | #181 | Fair 12.9% |
| Moroccans | 36.8 /100 | #182 | Fair 12.9% |
| Immigrants | West Indies | 33.0 /100 | #183 | Fair 12.9% |
| Immigrants | Trinidad and Tobago | 32.5 /100 | #184 | Fair 12.9% |
| Norwegians | 32.0 /100 | #185 | Fair 12.9% |
| Nigerians | 31.9 /100 | #186 | Fair 12.9% |
| Immigrants | Kuwait | 31.9 /100 | #187 | Fair 12.9% |
| Macedonians | 31.5 /100 | #188 | Fair 12.9% |
| Portuguese | 30.2 /100 | #189 | Fair 12.9% |
| Arabs | 27.0 /100 | #190 | Fair 13.0% |
| Immigrants | Thailand | 26.6 /100 | #191 | Fair 13.0% |
| Immigrants | Jamaica | 26.5 /100 | #192 | Fair 13.0% |
Demographics Similar to Creek by Single Male Poverty
In terms of single male poverty, the demographic groups most similar to Creek are Immigrants from Yemen (16.9%, a difference of 0.11%), Choctaw (17.0%, a difference of 0.83%), Shoshone (16.7%, a difference of 1.0%), Osage (16.5%, a difference of 2.3%), and Marshallese (16.4%, a difference of 2.4%).
| Demographics | Rating | Rank | Single Male Poverty |
| Dutch West Indians | 0.0 /100 | #316 | Tragic 16.1% |
| Blacks/African Americans | 0.0 /100 | #317 | Tragic 16.2% |
| Chickasaw | 0.0 /100 | #318 | Tragic 16.3% |
| Chippewa | 0.0 /100 | #319 | Tragic 16.4% |
| Marshallese | 0.0 /100 | #320 | Tragic 16.4% |
| Osage | 0.0 /100 | #321 | Tragic 16.5% |
| Shoshone | 0.0 /100 | #322 | Tragic 16.7% |
| Creek | 0.0 /100 | #323 | Tragic 16.8% |
| Immigrants | Yemen | 0.0 /100 | #324 | Tragic 16.9% |
| Choctaw | 0.0 /100 | #325 | Tragic 17.0% |
| Central American Indians | 0.0 /100 | #326 | Tragic 17.2% |
| Menominee | 0.0 /100 | #327 | Tragic 17.7% |
| Kiowa | 0.0 /100 | #328 | Tragic 18.3% |
| Colville | 0.0 /100 | #329 | Tragic 18.4% |
| Cajuns | 0.0 /100 | #330 | Tragic 19.1% |