Norwegian vs Immigrants from Turkey Single Male Poverty
COMPARE
Norwegian
Immigrants from Turkey
Single Male Poverty
Single Male Poverty Comparison
Norwegians
Immigrants from Turkey
12.9%
SINGLE MALE POVERTY
32.0/ 100
METRIC RATING
185th/ 347
METRIC RANK
12.1%
SINGLE MALE POVERTY
98.2/ 100
METRIC RATING
91st/ 347
METRIC RANK
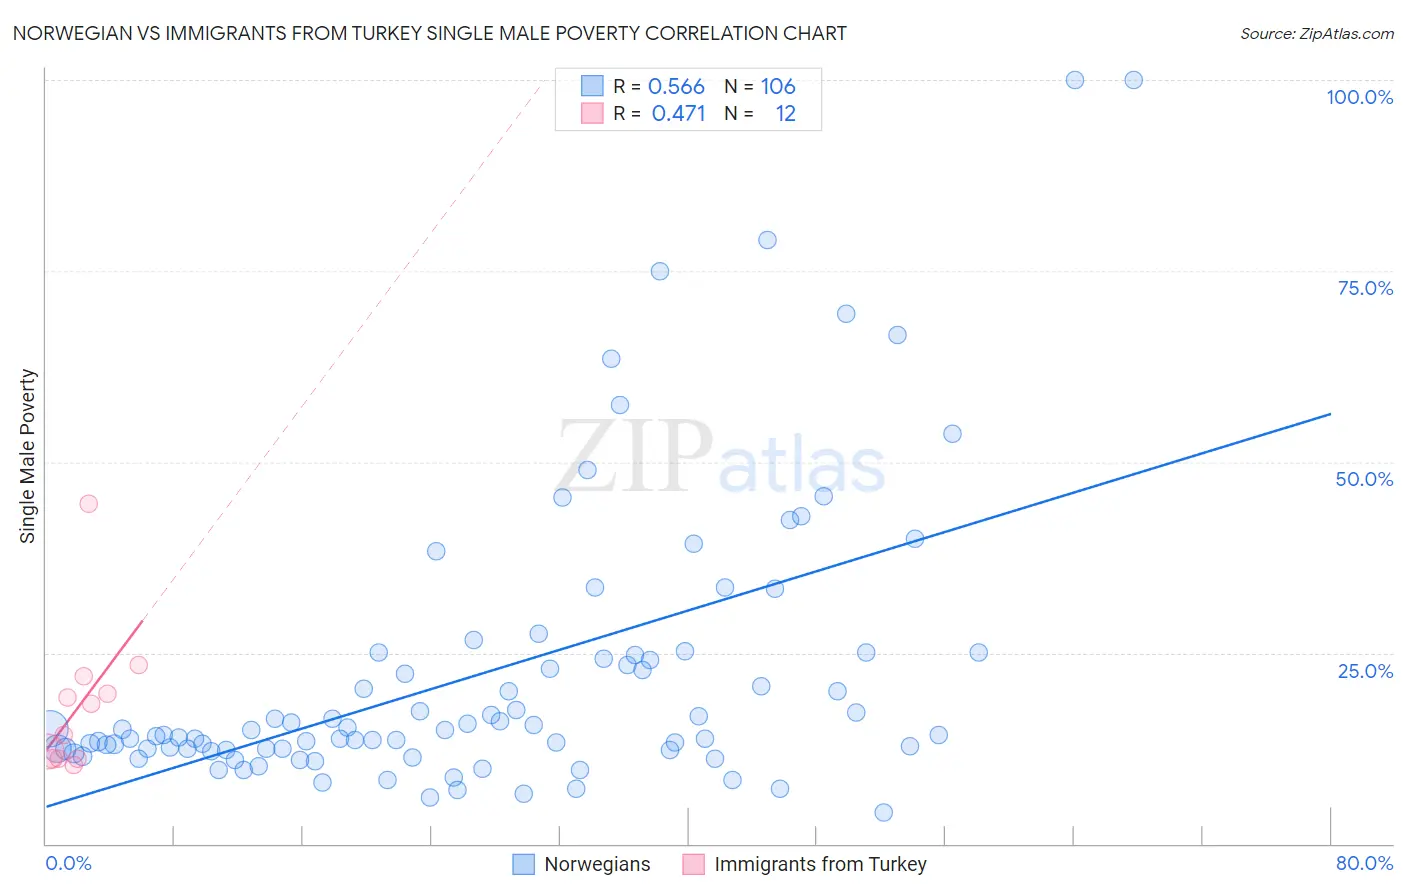
Norwegian vs Immigrants from Turkey Single Male Poverty Correlation Chart
The statistical analysis conducted on geographies consisting of 445,954,160 people shows a substantial positive correlation between the proportion of Norwegians and poverty level among single males in the United States with a correlation coefficient (R) of 0.566 and weighted average of 12.9%. Similarly, the statistical analysis conducted on geographies consisting of 203,227,813 people shows a moderate positive correlation between the proportion of Immigrants from Turkey and poverty level among single males in the United States with a correlation coefficient (R) of 0.471 and weighted average of 12.1%, a difference of 6.6%.
Single Male Poverty Correlation Summary
| Measurement | Norwegian | Immigrants from Turkey |
| Minimum | 4.2% | 10.3% |
| Maximum | 100.0% | 44.5% |
| Range | 95.8% | 34.2% |
| Mean | 22.4% | 18.1% |
| Median | 14.6% | 16.2% |
| Interquartile 25% (IQ1) | 12.4% | 11.1% |
| Interquartile 75% (IQ3) | 24.7% | 20.8% |
| Interquartile Range (IQR) | 12.3% | 9.6% |
| Standard Deviation (Sample) | 18.9% | 9.5% |
| Standard Deviation (Population) | 18.8% | 9.1% |
Similar Demographics by Single Male Poverty
Demographics Similar to Norwegians by Single Male Poverty
In terms of single male poverty, the demographic groups most similar to Norwegians are Nigerian (12.9%, a difference of 0.0%), Immigrants from Kuwait (12.9%, a difference of 0.010%), Immigrants from Trinidad and Tobago (12.9%, a difference of 0.030%), Macedonian (12.9%, a difference of 0.030%), and Immigrants from West Indies (12.9%, a difference of 0.060%).
| Demographics | Rating | Rank | Single Male Poverty |
| Immigrants | Switzerland | 43.1 /100 | #178 | Average 12.8% |
| Israelis | 41.0 /100 | #179 | Average 12.9% |
| Immigrants | North America | 37.7 /100 | #180 | Fair 12.9% |
| Panamanians | 37.6 /100 | #181 | Fair 12.9% |
| Moroccans | 36.8 /100 | #182 | Fair 12.9% |
| Immigrants | West Indies | 33.0 /100 | #183 | Fair 12.9% |
| Immigrants | Trinidad and Tobago | 32.5 /100 | #184 | Fair 12.9% |
| Norwegians | 32.0 /100 | #185 | Fair 12.9% |
| Nigerians | 31.9 /100 | #186 | Fair 12.9% |
| Immigrants | Kuwait | 31.9 /100 | #187 | Fair 12.9% |
| Macedonians | 31.5 /100 | #188 | Fair 12.9% |
| Portuguese | 30.2 /100 | #189 | Fair 12.9% |
| Arabs | 27.0 /100 | #190 | Fair 13.0% |
| Immigrants | Thailand | 26.6 /100 | #191 | Fair 13.0% |
| Immigrants | Jamaica | 26.5 /100 | #192 | Fair 13.0% |
Demographics Similar to Immigrants from Turkey by Single Male Poverty
In terms of single male poverty, the demographic groups most similar to Immigrants from Turkey are South American Indian (12.1%, a difference of 0.050%), Immigrants from Ireland (12.1%, a difference of 0.060%), Spanish American Indian (12.1%, a difference of 0.11%), Immigrants from Bosnia and Herzegovina (12.1%, a difference of 0.17%), and Immigrants from Eritrea (12.1%, a difference of 0.23%).
| Demographics | Rating | Rank | Single Male Poverty |
| Immigrants | Czechoslovakia | 98.6 /100 | #84 | Exceptional 12.1% |
| Turks | 98.5 /100 | #85 | Exceptional 12.1% |
| Immigrants | Israel | 98.5 /100 | #86 | Exceptional 12.1% |
| South Americans | 98.5 /100 | #87 | Exceptional 12.1% |
| Immigrants | Eritrea | 98.5 /100 | #88 | Exceptional 12.1% |
| Immigrants | Ireland | 98.3 /100 | #89 | Exceptional 12.1% |
| South American Indians | 98.3 /100 | #90 | Exceptional 12.1% |
| Immigrants | Turkey | 98.2 /100 | #91 | Exceptional 12.1% |
| Spanish American Indians | 98.0 /100 | #92 | Exceptional 12.1% |
| Immigrants | Bosnia and Herzegovina | 97.9 /100 | #93 | Exceptional 12.1% |
| Colombians | 97.8 /100 | #94 | Exceptional 12.2% |
| Mongolians | 97.7 /100 | #95 | Exceptional 12.2% |
| Immigrants | Sweden | 97.5 /100 | #96 | Exceptional 12.2% |
| Immigrants | Italy | 97.4 /100 | #97 | Exceptional 12.2% |
| Guamanians/Chamorros | 97.4 /100 | #98 | Exceptional 12.2% |