Paraguayan vs Creek Single Male Poverty

COMPARE

Paraguayan
Race
Ancestry
AfghanAfricanAlaska NativeAlaskan AthabascanAlbanianAleutAlsatianAmericanApacheArabArapahoArgentineanArmenianAssyrian/Chaldean/SyriacAustralianAustrianBahamianBangladeshiBarbadianBasqueBelgianBelizeanBermudanBhutaneseBlackfeetBolivianBrazilianBritishBritish West IndianBulgarianBurmeseCajunCambodianCanadianCape VerdeanCarpatho RusynCelticCentral AmericanCentral American IndianCherokeeCheyenneChickasawChileanChineseChippewaChoctawColombianColvilleComancheCosta RicanCreeCroatianCrowCubanCypriotCzechCzechoslovakianDanishDelawareDominicanDutchDutch West IndianEastern EuropeanEcuadorianEgyptianEnglishEstonianEthiopianEuropeanFijianFilipinoFinnishFrenchFrench American IndianFrench CanadianGermanGerman RussianGhanaianGreekGuamanian/ChamorroGuatemalanGuyaneseHaitianHmongHonduranHopiHoumaHungarianIcelanderIndian (Asian)IndonesianInupiatIranianIraqiIrishIroquoisIsraeliItalianJamaicanJapaneseJordanianKenyanKiowaKoreanLaotianLatvianLebaneseLiberianLithuanianLumbeeLuxembourgerMacedonianMalaysianMalteseMarshalleseMenomineeMexicanMexican American IndianMongolianMoroccanNative HawaiianNavajoNepaleseNew ZealanderNicaraguanNigerianNorthern EuropeanNorwegianOkinawanOsageOttawaPaiutePakistaniPalestinianPanamanianParaguayanPennsylvania GermanPeruvianPimaPolishPortuguesePotawatomiPuebloPuerto RicanPuget Sound SalishRomanianRussianSalvadoranSamoanScandinavianScotch-IrishScottishSeminoleSenegaleseSerbianShoshoneSierra LeoneanSiouxSlavicSlovakSloveneSomaliSouth AfricanSouth AmericanSouth American IndianSoviet UnionSpaniardSpanishSpanish AmericanSpanish American IndianSri LankanSubsaharan AfricanSudaneseSwedishSwissSyrianTaiwaneseThaiTlingit-HaidaTohono O'OdhamTonganTrinidadian and TobagonianTsimshianTurkishU.S. Virgin IslanderUgandanUkrainianUruguayanUteVenezuelanVietnameseWelshWest IndianYakamaYaquiYugoslavianYumanYup'ikZimbabwean
Immigration
NonimmigrantsImmigrantsAfghanistanAfricaAlbaniaArgentinaArmeniaAsiaAustraliaAustriaBahamasBangladeshBarbadosBelarusBelgiumBelizeBoliviaBosnia and HerzegovinaBrazilBulgariaBurma/MyanmarCabo VerdeCambodiaCameroonCanadaCaribbeanCentral AmericaChileChinaColombiaCongoCosta RicaCroatiaCubaCzechoslovakiaDenmarkDominicaDominican RepublicEastern AfricaEastern AsiaEastern EuropeEcuadorEgyptEl SalvadorEnglandEritreaEthiopiaEuropeFijiFranceGermanyGhanaGreeceGrenadaGuatemalaGuyanaHaitiHondurasHong KongHungaryIndiaIndonesiaIranIraqIrelandIsraelItalyJamaicaJapanJordanKazakhstanKenyaKoreaKuwaitLaosLatin AmericaLatviaLebanonLiberiaLithuaniaMalaysiaMexicoMicronesiaMiddle AfricaMoldovaMoroccoNepalNetherlandsNicaraguaNigeriaNorth AmericaNorth MacedoniaNorthern AfricaNorthern EuropeNorwayOceaniaPakistanPanamaPeruPhilippinesPolandPortugalRomaniaRussiaSaudi ArabiaScotlandSenegalSerbiaSierra LeoneSingaporeSomaliaSouth AfricaSouth AmericaSouth Central AsiaSouth Eastern AsiaSouthern EuropeSpainSri LankaSt. Vincent and the GrenadinesSudanSwedenSwitzerlandSyriaTaiwanThailandTrinidad and TobagoTurkeyUgandaUkraineUruguayUzbekistanVenezuelaVietnamWest IndiesWestern AfricaWestern AsiaWestern EuropeYemenZaireZimbabweAzores
Creek
Race
Ancestry
AfghanAfricanAlaska NativeAlaskan AthabascanAlbanianAleutAlsatianAmericanApacheArabArapahoArgentineanArmenianAssyrian/Chaldean/SyriacAustralianAustrianBahamianBangladeshiBarbadianBasqueBelgianBelizeanBermudanBhutaneseBlackfeetBolivianBrazilianBritishBritish West IndianBulgarianBurmeseCajunCambodianCanadianCape VerdeanCarpatho RusynCelticCentral AmericanCentral American IndianCherokeeCheyenneChickasawChileanChineseChippewaChoctawColombianColvilleComancheCosta RicanCreeCreekCroatianCrowCubanCypriotCzechCzechoslovakianDanishDelawareDominicanDutchDutch West IndianEastern EuropeanEcuadorianEgyptianEnglishEstonianEthiopianEuropeanFijianFilipinoFinnishFrenchFrench American IndianFrench CanadianGermanGerman RussianGhanaianGreekGuamanian/ChamorroGuatemalanGuyaneseHaitianHmongHonduranHopiHoumaHungarianIcelanderIndian (Asian)IndonesianInupiatIranianIraqiIrishIroquoisIsraeliItalianJamaicanJapaneseJordanianKenyanKiowaKoreanLaotianLatvianLebaneseLiberianLithuanianLumbeeLuxembourgerMacedonianMalaysianMalteseMarshalleseMenomineeMexicanMexican American IndianMongolianMoroccanNative HawaiianNavajoNepaleseNew ZealanderNicaraguanNigerianNorthern EuropeanNorwegianOkinawanOsageOttawaPaiutePakistaniPalestinianPanamanianPennsylvania GermanPeruvianPimaPolishPortuguesePotawatomiPuebloPuerto RicanPuget Sound SalishRomanianRussianSalvadoranSamoanScandinavianScotch-IrishScottishSeminoleSenegaleseSerbianShoshoneSierra LeoneanSiouxSlavicSlovakSloveneSomaliSouth AfricanSouth AmericanSouth American IndianSoviet UnionSpaniardSpanishSpanish AmericanSpanish American IndianSri LankanSubsaharan AfricanSudaneseSwedishSwissSyrianTaiwaneseThaiTlingit-HaidaTohono O'OdhamTonganTrinidadian and TobagonianTsimshianTurkishU.S. Virgin IslanderUgandanUkrainianUruguayanUteVenezuelanVietnameseWelshWest IndianYakamaYaquiYugoslavianYumanYup'ikZimbabwean
Immigration
NonimmigrantsImmigrantsAfghanistanAfricaAlbaniaArgentinaArmeniaAsiaAustraliaAustriaBahamasBangladeshBarbadosBelarusBelgiumBelizeBoliviaBosnia and HerzegovinaBrazilBulgariaBurma/MyanmarCabo VerdeCambodiaCameroonCanadaCaribbeanCentral AmericaChileChinaColombiaCongoCosta RicaCroatiaCubaCzechoslovakiaDenmarkDominicaDominican RepublicEastern AfricaEastern AsiaEastern EuropeEcuadorEgyptEl SalvadorEnglandEritreaEthiopiaEuropeFijiFranceGermanyGhanaGreeceGrenadaGuatemalaGuyanaHaitiHondurasHong KongHungaryIndiaIndonesiaIranIraqIrelandIsraelItalyJamaicaJapanJordanKazakhstanKenyaKoreaKuwaitLaosLatin AmericaLatviaLebanonLiberiaLithuaniaMalaysiaMexicoMicronesiaMiddle AfricaMoldovaMoroccoNepalNetherlandsNicaraguaNigeriaNorth AmericaNorth MacedoniaNorthern AfricaNorthern EuropeNorwayOceaniaPakistanPanamaPeruPhilippinesPolandPortugalRomaniaRussiaSaudi ArabiaScotlandSenegalSerbiaSierra LeoneSingaporeSomaliaSouth AfricaSouth AmericaSouth Central AsiaSouth Eastern AsiaSouthern EuropeSpainSri LankaSt. Vincent and the GrenadinesSudanSwedenSwitzerlandSyriaTaiwanThailandTrinidad and TobagoTurkeyUgandaUkraineUruguayUzbekistanVenezuelaVietnamWest IndiesWestern AfricaWestern AsiaWestern EuropeYemenZaireZimbabweAzores
Single Male Poverty
Income
Poverty
Unemployment
Labor Participation
Family Structure
Vehicle Availability
Education Level
Disability

Single Male Poverty Comparison

Paraguayans

Creek

Exceptional
Tragic
11.6%
SINGLE MALE POVERTY
99.9/ 100
METRIC RATING
51st/ 347
METRIC RANK
16.8%
SINGLE MALE POVERTY
0.0/ 100
METRIC RATING
323rd/ 347
METRIC RANK

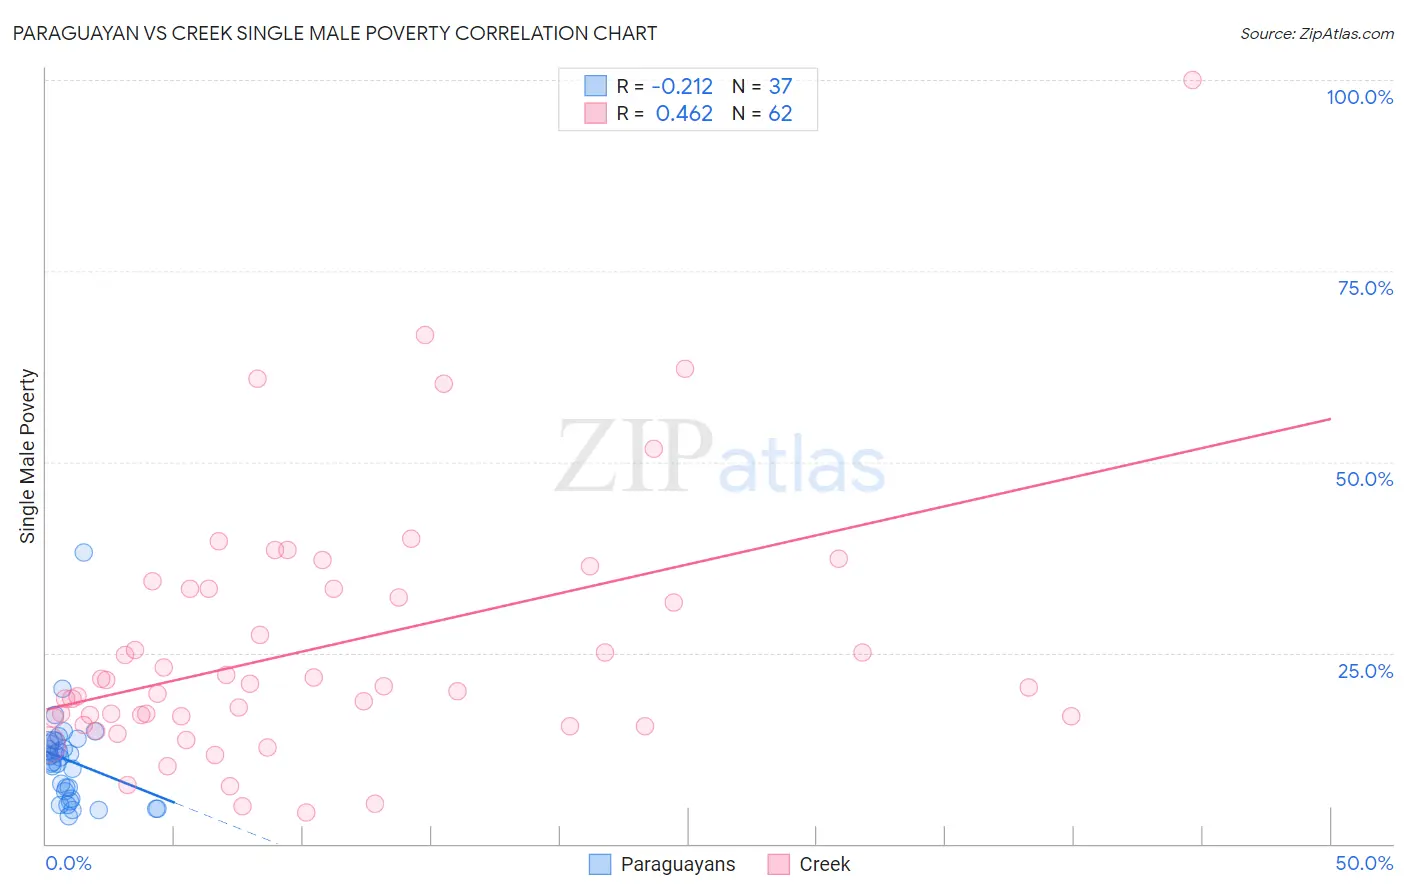
Paraguayan vs Creek Single Male Poverty Correlation Chart

The statistical analysis conducted on geographies consisting of 90,716,103 people shows a weak negative correlation between the proportion of Paraguayans and poverty level among single males in the United States with a correlation coefficient (R) of -0.212 and weighted average of 11.6%. Similarly, the statistical analysis conducted on geographies consisting of 168,159,894 people shows a moderate positive correlation between the proportion of Creek and poverty level among single males in the United States with a correlation coefficient (R) of 0.462 and weighted average of 16.8%, a difference of 45.0%.
Paraguayan vs Creek Single Male Poverty

Single Male Poverty Correlation Summary

MeasurementParaguayanCreek
Minimum3.6%4.0%
Maximum38.1%100.0%
Range34.5%96.0%
Mean10.9%25.8%
Median11.3%20.6%
Interquartile 25% (IQ1)6.4%16.5%
Interquartile 75% (IQ3)13.2%33.3%
Interquartile Range (IQR)6.8%16.9%
Standard Deviation (Sample)6.1%17.0%
Standard Deviation (Population)6.0%16.9%

Similar Demographics by Single Male Poverty

Demographics Similar to Paraguayans by Single Male Poverty

In terms of single male poverty, the demographic groups most similar to Paraguayans are Immigrants from Lithuania (11.6%, a difference of 0.11%), Tlingit-Haida (11.6%, a difference of 0.17%), Immigrants from Indonesia (11.6%, a difference of 0.19%), Nepalese (11.6%, a difference of 0.26%), and Samoan (11.7%, a difference of 0.31%).
DemographicsRating | RankSingle Male Poverty
Immigrants | Cameroon
99.9
/100
|
#44
Exceptional
11.5%
Immigrants | Poland
99.9
/100
|
#45
Exceptional
11.5%
Immigrants | Bulgaria
99.9
/100
|
#46
Exceptional
11.6%
Nepalese
99.9
/100
|
#47
Exceptional
11.6%
Immigrants | Indonesia
99.9
/100
|
#48
Exceptional
11.6%
Tlingit-Haida
99.9
/100
|
#49
Exceptional
11.6%
Immigrants | Lithuania
99.9
/100
|
#50
Exceptional
11.6%
Paraguayans
99.9
/100
|
#51
Exceptional
11.6%
Samoans
99.9
/100
|
#52
Exceptional
11.7%
Bulgarians
99.9
/100
|
#53
Exceptional
11.7%
Immigrants | Uzbekistan
99.9
/100
|
#54
Exceptional
11.7%
Cypriots
99.9
/100
|
#55
Exceptional
11.7%
Burmese
99.8
/100
|
#56
Exceptional
11.7%
Immigrants | Romania
99.8
/100
|
#57
Exceptional
11.7%
Immigrants | Brazil
99.8
/100
|
#58
Exceptional
11.7%

Demographics Similar to Creek by Single Male Poverty

In terms of single male poverty, the demographic groups most similar to Creek are Immigrants from Yemen (16.9%, a difference of 0.11%), Choctaw (17.0%, a difference of 0.83%), Shoshone (16.7%, a difference of 1.0%), Osage (16.5%, a difference of 2.3%), and Marshallese (16.4%, a difference of 2.4%).
DemographicsRating | RankSingle Male Poverty
Dutch West Indians
0.0
/100
|
#316
Tragic
16.1%
Blacks/African Americans
0.0
/100
|
#317
Tragic
16.2%
Chickasaw
0.0
/100
|
#318
Tragic
16.3%
Chippewa
0.0
/100
|
#319
Tragic
16.4%
Marshallese
0.0
/100
|
#320
Tragic
16.4%
Osage
0.0
/100
|
#321
Tragic
16.5%
Shoshone
0.0
/100
|
#322
Tragic
16.7%
Creek
0.0
/100
|
#323
Tragic
16.8%
Immigrants | Yemen
0.0
/100
|
#324
Tragic
16.9%
Choctaw
0.0
/100
|
#325
Tragic
17.0%
Central American Indians
0.0
/100
|
#326
Tragic
17.2%
Menominee
0.0
/100
|
#327
Tragic
17.7%
Kiowa
0.0
/100
|
#328
Tragic
18.3%
Colville
0.0
/100
|
#329
Tragic
18.4%
Cajuns
0.0
/100
|
#330
Tragic
19.1%