Nonimmigrants vs Central American Female Poverty
COMPARE
Nonimmigrants
Central American
Female Poverty
Female Poverty Comparison
Nonimmigrants
Central Americans
14.5%
FEMALE POVERTY
3.7/ 100
METRIC RATING
222nd/ 347
METRIC RANK
16.0%
FEMALE POVERTY
0.0/ 100
METRIC RATING
276th/ 347
METRIC RANK
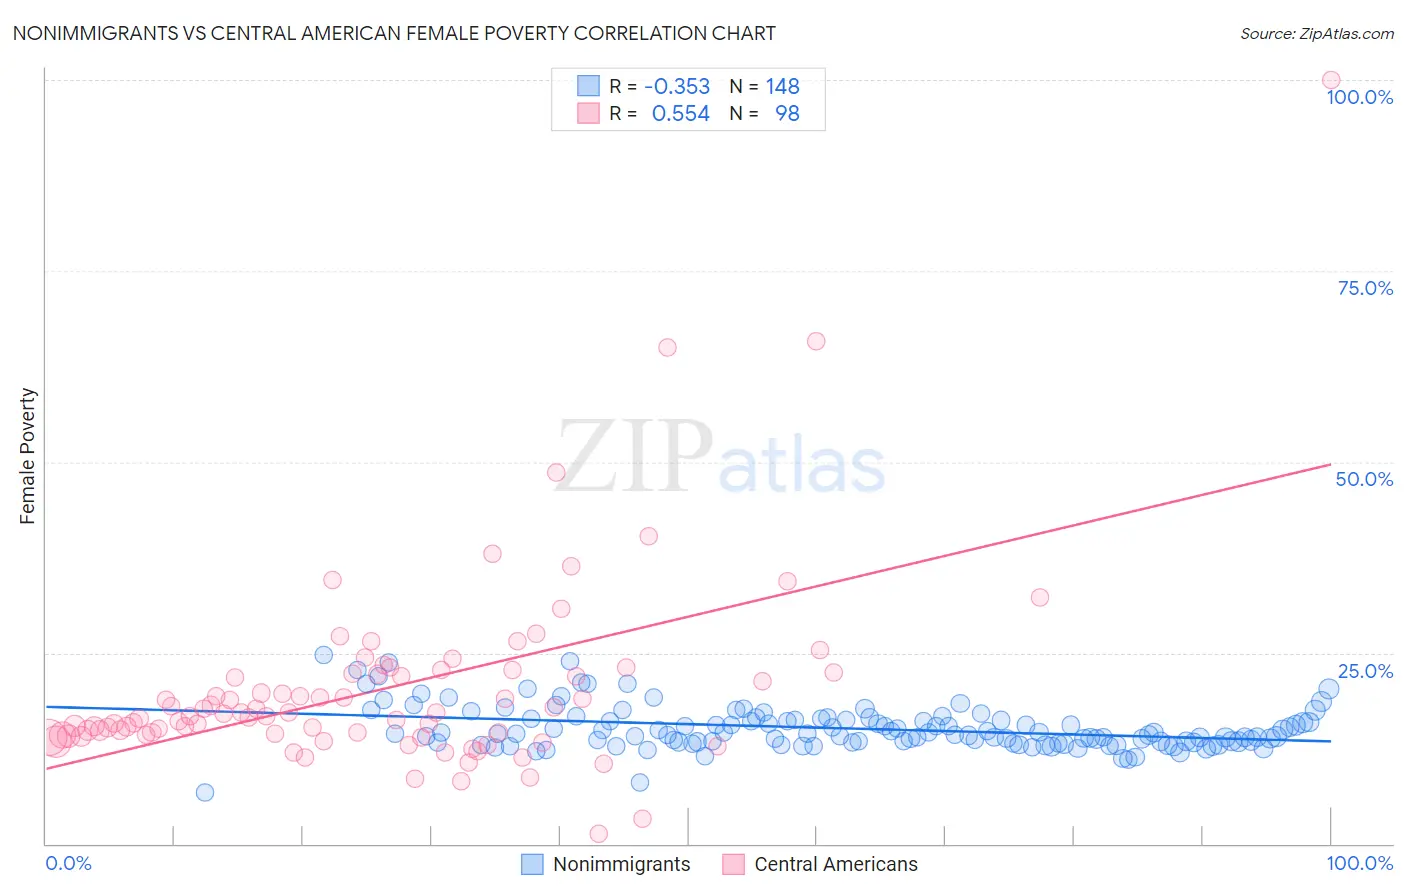
Nonimmigrants vs Central American Female Poverty Correlation Chart
The statistical analysis conducted on geographies consisting of 583,225,965 people shows a mild negative correlation between the proportion of Nonimmigrants and poverty level among females in the United States with a correlation coefficient (R) of -0.353 and weighted average of 14.5%. Similarly, the statistical analysis conducted on geographies consisting of 503,924,730 people shows a substantial positive correlation between the proportion of Central Americans and poverty level among females in the United States with a correlation coefficient (R) of 0.554 and weighted average of 16.0%, a difference of 10.2%.
Female Poverty Correlation Summary
| Measurement | Nonimmigrants | Central American |
| Minimum | 6.7% | 1.3% |
| Maximum | 24.7% | 100.0% |
| Range | 18.0% | 98.8% |
| Mean | 15.1% | 20.2% |
| Median | 14.4% | 16.9% |
| Interquartile 25% (IQ1) | 13.3% | 14.3% |
| Interquartile 75% (IQ3) | 16.3% | 22.2% |
| Interquartile Range (IQR) | 3.0% | 7.9% |
| Standard Deviation (Sample) | 2.8% | 12.8% |
| Standard Deviation (Population) | 2.8% | 12.8% |
Similar Demographics by Female Poverty
Demographics Similar to Nonimmigrants by Female Poverty
In terms of female poverty, the demographic groups most similar to Nonimmigrants are Immigrants from Cambodia (14.5%, a difference of 0.020%), Alsatian (14.5%, a difference of 0.22%), Immigrants from Africa (14.5%, a difference of 0.23%), Japanese (14.5%, a difference of 0.26%), and Immigrants from Uzbekistan (14.4%, a difference of 0.40%).
| Demographics | Rating | Rank | Female Poverty |
| Immigrants | Panama | 4.7 /100 | #215 | Tragic 14.4% |
| Immigrants | Thailand | 4.5 /100 | #216 | Tragic 14.4% |
| Immigrants | Immigrants | 4.5 /100 | #217 | Tragic 14.4% |
| Immigrants | Uzbekistan | 4.4 /100 | #218 | Tragic 14.4% |
| Japanese | 4.1 /100 | #219 | Tragic 14.5% |
| Alsatians | 4.0 /100 | #220 | Tragic 14.5% |
| Immigrants | Cambodia | 3.7 /100 | #221 | Tragic 14.5% |
| Immigrants | Nonimmigrants | 3.7 /100 | #222 | Tragic 14.5% |
| Immigrants | Africa | 3.3 /100 | #223 | Tragic 14.5% |
| Americans | 2.8 /100 | #224 | Tragic 14.6% |
| Immigrants | Micronesia | 2.8 /100 | #225 | Tragic 14.6% |
| Immigrants | Eritrea | 2.4 /100 | #226 | Tragic 14.6% |
| Immigrants | Nigeria | 2.1 /100 | #227 | Tragic 14.7% |
| German Russians | 2.0 /100 | #228 | Tragic 14.7% |
| Ghanaians | 1.9 /100 | #229 | Tragic 14.7% |
Demographics Similar to Central Americans by Female Poverty
In terms of female poverty, the demographic groups most similar to Central Americans are Immigrants from Barbados (16.0%, a difference of 0.13%), Barbadian (15.9%, a difference of 0.19%), Bangladeshi (16.0%, a difference of 0.19%), Belizean (15.9%, a difference of 0.20%), and Haitian (15.9%, a difference of 0.20%).
| Demographics | Rating | Rank | Female Poverty |
| Iroquois | 0.1 /100 | #269 | Tragic 15.8% |
| Chickasaw | 0.1 /100 | #270 | Tragic 15.9% |
| Immigrants | St. Vincent and the Grenadines | 0.0 /100 | #271 | Tragic 15.9% |
| Belizeans | 0.0 /100 | #272 | Tragic 15.9% |
| Haitians | 0.0 /100 | #273 | Tragic 15.9% |
| Barbadians | 0.0 /100 | #274 | Tragic 15.9% |
| Immigrants | Barbados | 0.0 /100 | #275 | Tragic 16.0% |
| Central Americans | 0.0 /100 | #276 | Tragic 16.0% |
| Bangladeshis | 0.0 /100 | #277 | Tragic 16.0% |
| Immigrants | West Indies | 0.0 /100 | #278 | Tragic 16.1% |
| Immigrants | Bahamas | 0.0 /100 | #279 | Tragic 16.1% |
| Vietnamese | 0.0 /100 | #280 | Tragic 16.1% |
| West Indians | 0.0 /100 | #281 | Tragic 16.1% |
| Immigrants | Haiti | 0.0 /100 | #282 | Tragic 16.1% |
| Immigrants | Cuba | 0.0 /100 | #283 | Tragic 16.1% |