Nonimmigrants vs Dutch West Indian Female Poverty
COMPARE
Nonimmigrants
Dutch West Indian
Female Poverty
Female Poverty Comparison
Nonimmigrants
Dutch West Indians
14.5%
FEMALE POVERTY
3.7/ 100
METRIC RATING
222nd/ 347
METRIC RANK
17.1%
FEMALE POVERTY
0.0/ 100
METRIC RATING
314th/ 347
METRIC RANK
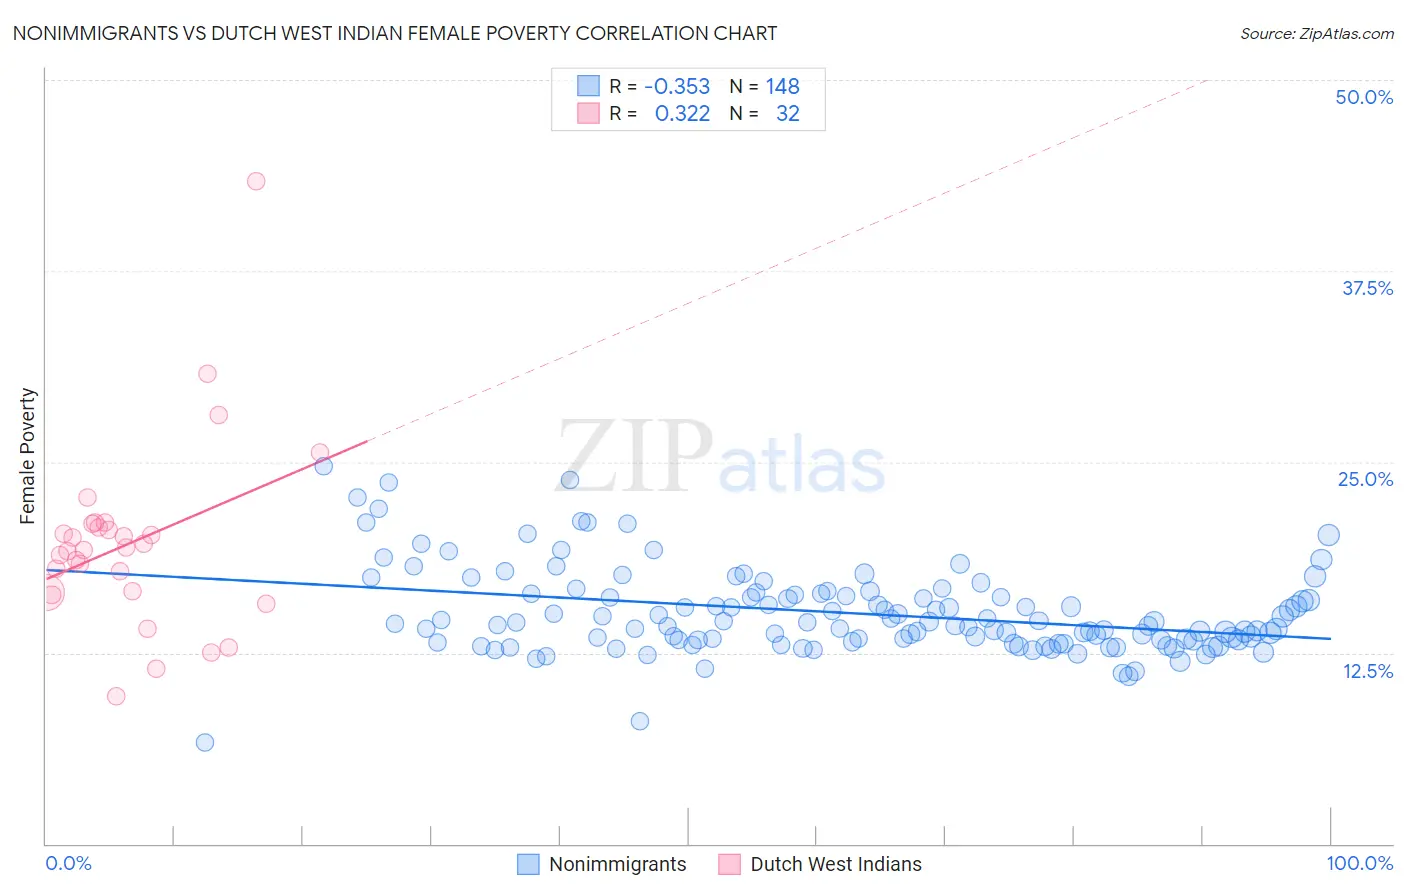
Nonimmigrants vs Dutch West Indian Female Poverty Correlation Chart
The statistical analysis conducted on geographies consisting of 583,225,965 people shows a mild negative correlation between the proportion of Nonimmigrants and poverty level among females in the United States with a correlation coefficient (R) of -0.353 and weighted average of 14.5%. Similarly, the statistical analysis conducted on geographies consisting of 85,761,145 people shows a mild positive correlation between the proportion of Dutch West Indians and poverty level among females in the United States with a correlation coefficient (R) of 0.322 and weighted average of 17.1%, a difference of 17.8%.
Female Poverty Correlation Summary
| Measurement | Nonimmigrants | Dutch West Indian |
| Minimum | 6.7% | 9.6% |
| Maximum | 24.7% | 43.3% |
| Range | 18.0% | 33.7% |
| Mean | 15.1% | 19.7% |
| Median | 14.4% | 19.3% |
| Interquartile 25% (IQ1) | 13.3% | 16.5% |
| Interquartile 75% (IQ3) | 16.3% | 20.8% |
| Interquartile Range (IQR) | 3.0% | 4.3% |
| Standard Deviation (Sample) | 2.8% | 6.1% |
| Standard Deviation (Population) | 2.8% | 6.0% |
Similar Demographics by Female Poverty
Demographics Similar to Nonimmigrants by Female Poverty
In terms of female poverty, the demographic groups most similar to Nonimmigrants are Immigrants from Cambodia (14.5%, a difference of 0.020%), Alsatian (14.5%, a difference of 0.22%), Immigrants from Africa (14.5%, a difference of 0.23%), Japanese (14.5%, a difference of 0.26%), and Immigrants from Uzbekistan (14.4%, a difference of 0.40%).
| Demographics | Rating | Rank | Female Poverty |
| Immigrants | Panama | 4.7 /100 | #215 | Tragic 14.4% |
| Immigrants | Thailand | 4.5 /100 | #216 | Tragic 14.4% |
| Immigrants | Immigrants | 4.5 /100 | #217 | Tragic 14.4% |
| Immigrants | Uzbekistan | 4.4 /100 | #218 | Tragic 14.4% |
| Japanese | 4.1 /100 | #219 | Tragic 14.5% |
| Alsatians | 4.0 /100 | #220 | Tragic 14.5% |
| Immigrants | Cambodia | 3.7 /100 | #221 | Tragic 14.5% |
| Immigrants | Nonimmigrants | 3.7 /100 | #222 | Tragic 14.5% |
| Immigrants | Africa | 3.3 /100 | #223 | Tragic 14.5% |
| Americans | 2.8 /100 | #224 | Tragic 14.6% |
| Immigrants | Micronesia | 2.8 /100 | #225 | Tragic 14.6% |
| Immigrants | Eritrea | 2.4 /100 | #226 | Tragic 14.6% |
| Immigrants | Nigeria | 2.1 /100 | #227 | Tragic 14.7% |
| German Russians | 2.0 /100 | #228 | Tragic 14.7% |
| Ghanaians | 1.9 /100 | #229 | Tragic 14.7% |
Demographics Similar to Dutch West Indians by Female Poverty
In terms of female poverty, the demographic groups most similar to Dutch West Indians are British West Indian (17.0%, a difference of 0.25%), Immigrants from Somalia (17.0%, a difference of 0.33%), Creek (17.0%, a difference of 0.42%), Immigrants from Guatemala (17.0%, a difference of 0.42%), and Immigrants from Mexico (17.0%, a difference of 0.67%).
| Demographics | Rating | Rank | Female Poverty |
| Seminole | 0.0 /100 | #307 | Tragic 16.9% |
| Africans | 0.0 /100 | #308 | Tragic 16.9% |
| Immigrants | Mexico | 0.0 /100 | #309 | Tragic 17.0% |
| Creek | 0.0 /100 | #310 | Tragic 17.0% |
| Immigrants | Guatemala | 0.0 /100 | #311 | Tragic 17.0% |
| Immigrants | Somalia | 0.0 /100 | #312 | Tragic 17.0% |
| British West Indians | 0.0 /100 | #313 | Tragic 17.0% |
| Dutch West Indians | 0.0 /100 | #314 | Tragic 17.1% |
| U.S. Virgin Islanders | 0.0 /100 | #315 | Tragic 17.3% |
| Hondurans | 0.0 /100 | #316 | Tragic 17.4% |
| Immigrants | Congo | 0.0 /100 | #317 | Tragic 17.4% |
| Ute | 0.0 /100 | #318 | Tragic 17.5% |
| Cajuns | 0.0 /100 | #319 | Tragic 17.5% |
| Immigrants | Dominica | 0.0 /100 | #320 | Tragic 17.5% |
| Arapaho | 0.0 /100 | #321 | Tragic 17.5% |