Nigerian vs Immigrants from Trinidad and Tobago Receiving Food Stamps
COMPARE
Nigerian
Immigrants from Trinidad and Tobago
Receiving Food Stamps
Receiving Food Stamps Comparison
Nigerians
Immigrants from Trinidad and Tobago
13.1%
RECEIVING FOOD STAMPS
3.5/ 100
METRIC RATING
227th/ 347
METRIC RANK
15.8%
RECEIVING FOOD STAMPS
0.0/ 100
METRIC RATING
298th/ 347
METRIC RANK
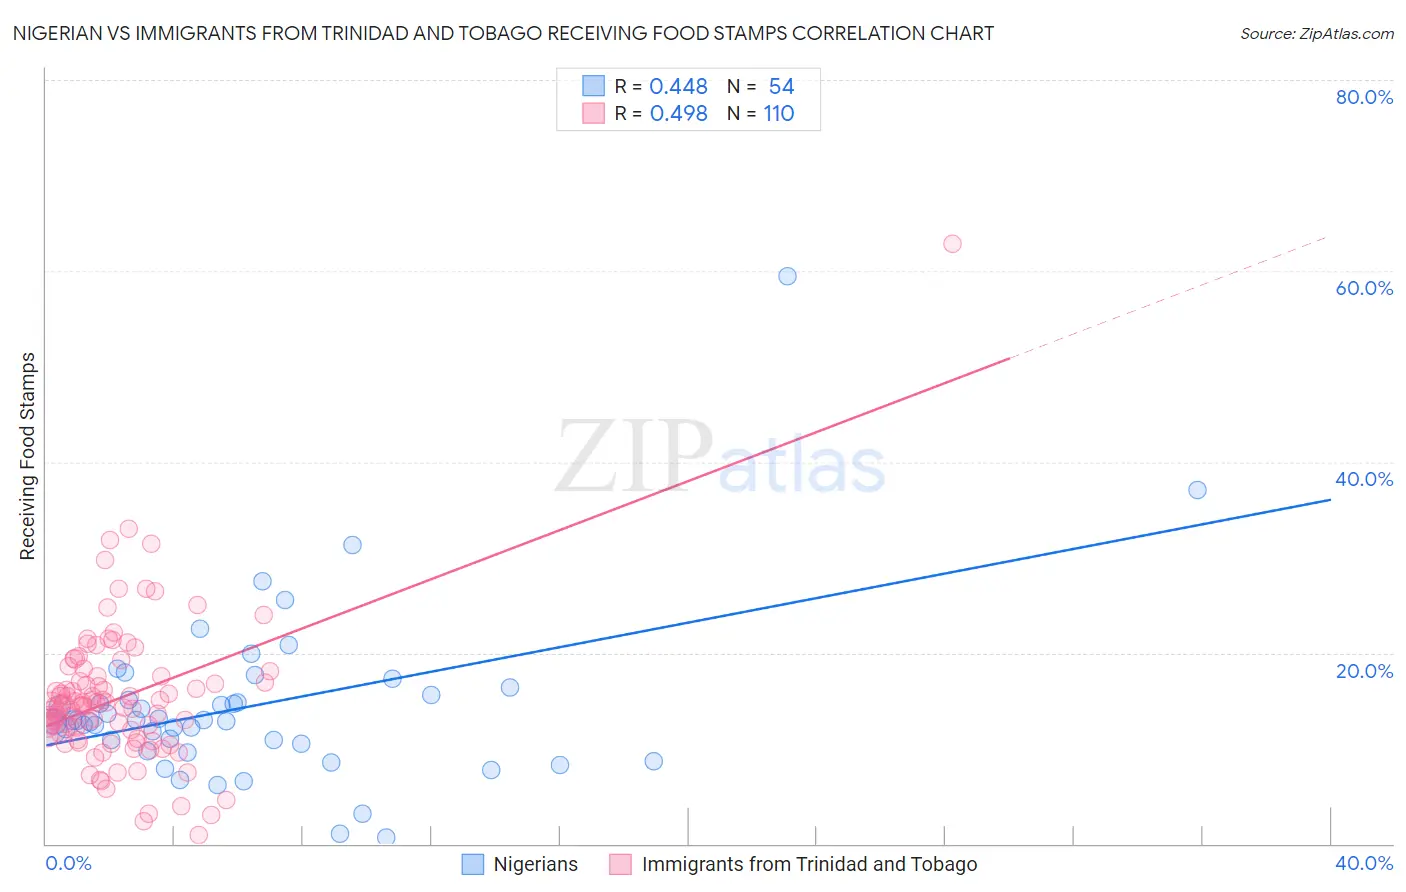
Nigerian vs Immigrants from Trinidad and Tobago Receiving Food Stamps Correlation Chart
The statistical analysis conducted on geographies consisting of 332,095,835 people shows a moderate positive correlation between the proportion of Nigerians and percentage of population receiving government assistance and/or food stamps in the United States with a correlation coefficient (R) of 0.448 and weighted average of 13.1%. Similarly, the statistical analysis conducted on geographies consisting of 223,195,672 people shows a moderate positive correlation between the proportion of Immigrants from Trinidad and Tobago and percentage of population receiving government assistance and/or food stamps in the United States with a correlation coefficient (R) of 0.498 and weighted average of 15.8%, a difference of 20.6%.
Receiving Food Stamps Correlation Summary
| Measurement | Nigerian | Immigrants from Trinidad and Tobago |
| Minimum | 0.60% | 0.90% |
| Maximum | 59.5% | 62.8% |
| Range | 58.9% | 61.9% |
| Mean | 14.4% | 15.2% |
| Median | 12.9% | 14.5% |
| Interquartile 25% (IQ1) | 10.5% | 11.2% |
| Interquartile 75% (IQ3) | 15.6% | 17.5% |
| Interquartile Range (IQR) | 5.1% | 6.3% |
| Standard Deviation (Sample) | 9.1% | 7.6% |
| Standard Deviation (Population) | 9.0% | 7.6% |
Similar Demographics by Receiving Food Stamps
Demographics Similar to Nigerians by Receiving Food Stamps
In terms of receiving food stamps, the demographic groups most similar to Nigerians are Panamanian (13.1%, a difference of 0.010%), Ottawa (13.1%, a difference of 0.020%), Chickasaw (13.1%, a difference of 0.050%), Puget Sound Salish (13.1%, a difference of 0.070%), and Immigrants from Nigeria (13.1%, a difference of 0.11%).
| Demographics | Rating | Rank | Receiving Food Stamps |
| Immigrants | Colombia | 5.3 /100 | #220 | Tragic 12.9% |
| Bermudans | 4.8 /100 | #221 | Tragic 13.0% |
| Immigrants | Immigrants | 4.4 /100 | #222 | Tragic 13.0% |
| Immigrants | Albania | 4.4 /100 | #223 | Tragic 13.0% |
| Immigrants | Armenia | 4.3 /100 | #224 | Tragic 13.0% |
| Fijians | 4.3 /100 | #225 | Tragic 13.0% |
| Chickasaw | 3.6 /100 | #226 | Tragic 13.1% |
| Nigerians | 3.5 /100 | #227 | Tragic 13.1% |
| Panamanians | 3.5 /100 | #228 | Tragic 13.1% |
| Ottawa | 3.5 /100 | #229 | Tragic 13.1% |
| Puget Sound Salish | 3.4 /100 | #230 | Tragic 13.1% |
| Immigrants | Nigeria | 3.4 /100 | #231 | Tragic 13.1% |
| Salvadorans | 2.7 /100 | #232 | Tragic 13.2% |
| Cherokee | 2.5 /100 | #233 | Tragic 13.2% |
| Comanche | 2.4 /100 | #234 | Tragic 13.3% |
Demographics Similar to Immigrants from Trinidad and Tobago by Receiving Food Stamps
In terms of receiving food stamps, the demographic groups most similar to Immigrants from Trinidad and Tobago are Immigrants from Bahamas (15.8%, a difference of 0.25%), Hispanic or Latino (15.8%, a difference of 0.28%), Tsimshian (15.7%, a difference of 0.41%), Immigrants from Honduras (15.7%, a difference of 0.42%), and Immigrants from Bangladesh (15.9%, a difference of 0.71%).
| Demographics | Rating | Rank | Receiving Food Stamps |
| Hondurans | 0.0 /100 | #291 | Tragic 15.5% |
| Alaska Natives | 0.0 /100 | #292 | Tragic 15.6% |
| Vietnamese | 0.0 /100 | #293 | Tragic 15.7% |
| Immigrants | Latin America | 0.0 /100 | #294 | Tragic 15.7% |
| Immigrants | Honduras | 0.0 /100 | #295 | Tragic 15.7% |
| Tsimshian | 0.0 /100 | #296 | Tragic 15.7% |
| Immigrants | Bahamas | 0.0 /100 | #297 | Tragic 15.8% |
| Immigrants | Trinidad and Tobago | 0.0 /100 | #298 | Tragic 15.8% |
| Hispanics or Latinos | 0.0 /100 | #299 | Tragic 15.8% |
| Immigrants | Bangladesh | 0.0 /100 | #300 | Tragic 15.9% |
| Trinidadians and Tobagonians | 0.0 /100 | #301 | Tragic 16.0% |
| Immigrants | West Indies | 0.0 /100 | #302 | Tragic 16.1% |
| Nicaraguans | 0.0 /100 | #303 | Tragic 16.1% |
| West Indians | 0.0 /100 | #304 | Tragic 16.3% |
| Immigrants | Azores | 0.0 /100 | #305 | Tragic 16.4% |