Nigerian vs Immigrants from Malaysia Family Poverty
COMPARE
Nigerian
Immigrants from Malaysia
Family Poverty
Family Poverty Comparison
Nigerians
Immigrants from Malaysia
10.1%
FAMILY POVERTY
2.0/ 100
METRIC RATING
235th/ 347
METRIC RANK
8.5%
FAMILY POVERTY
86.5/ 100
METRIC RATING
135th/ 347
METRIC RANK
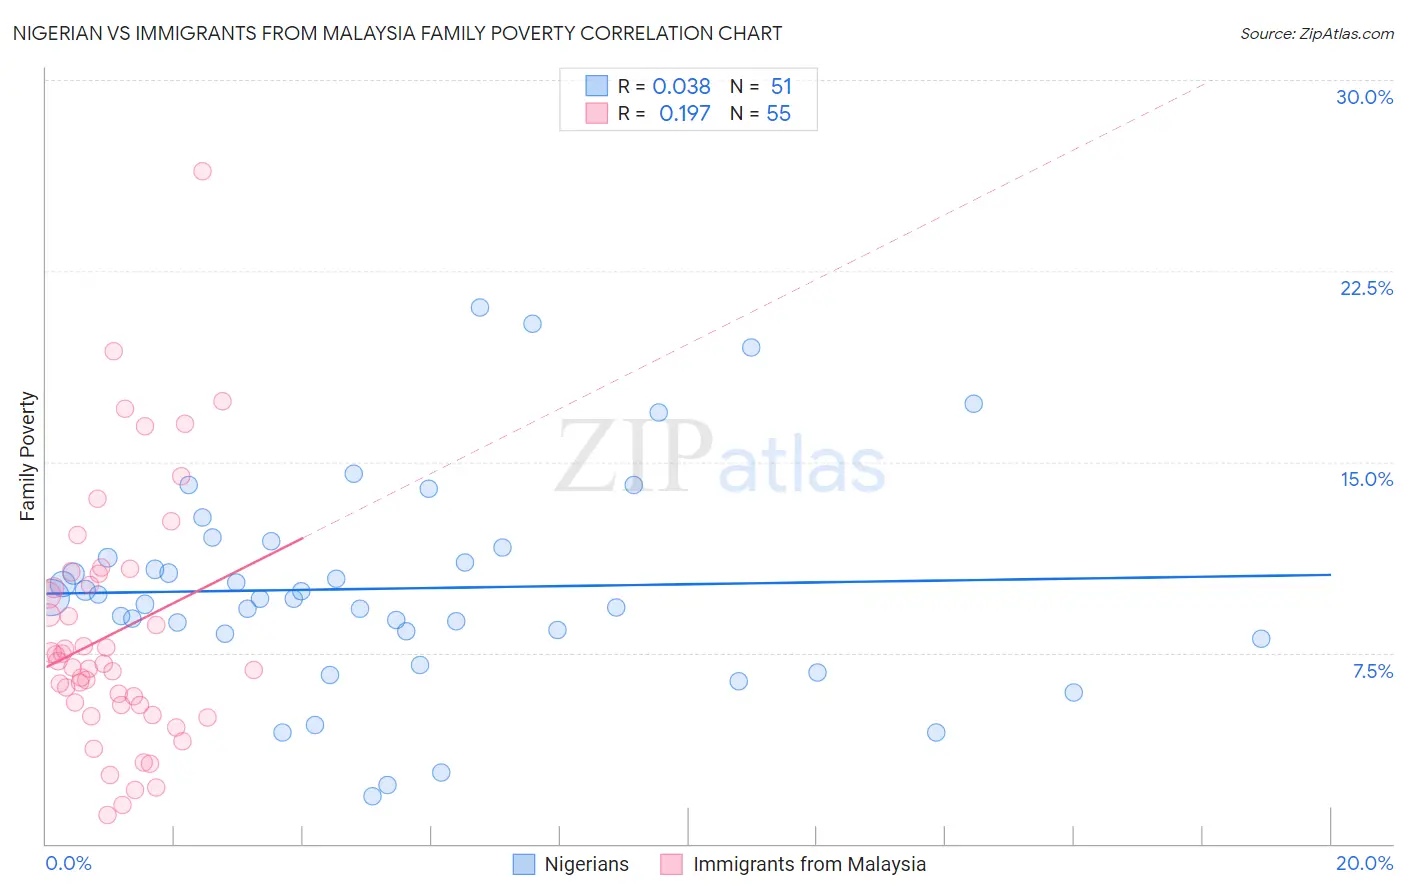
Nigerian vs Immigrants from Malaysia Family Poverty Correlation Chart
The statistical analysis conducted on geographies consisting of 332,122,343 people shows no correlation between the proportion of Nigerians and poverty level among families in the United States with a correlation coefficient (R) of 0.038 and weighted average of 10.1%. Similarly, the statistical analysis conducted on geographies consisting of 197,782,180 people shows a poor positive correlation between the proportion of Immigrants from Malaysia and poverty level among families in the United States with a correlation coefficient (R) of 0.197 and weighted average of 8.5%, a difference of 19.9%.
Family Poverty Correlation Summary
| Measurement | Nigerian | Immigrants from Malaysia |
| Minimum | 1.9% | 1.1% |
| Maximum | 21.1% | 26.4% |
| Range | 19.2% | 25.3% |
| Mean | 10.0% | 8.3% |
| Median | 9.6% | 7.1% |
| Interquartile 25% (IQ1) | 8.3% | 5.4% |
| Interquartile 75% (IQ3) | 11.6% | 10.6% |
| Interquartile Range (IQR) | 3.4% | 5.2% |
| Standard Deviation (Sample) | 4.2% | 4.9% |
| Standard Deviation (Population) | 4.1% | 4.8% |
Similar Demographics by Family Poverty
Demographics Similar to Nigerians by Family Poverty
In terms of family poverty, the demographic groups most similar to Nigerians are Immigrants from Middle Africa (10.1%, a difference of 0.030%), Fijian (10.1%, a difference of 0.14%), Immigrants from Nigeria (10.2%, a difference of 0.25%), Immigrants from Sudan (10.1%, a difference of 0.39%), and Immigrants from Laos (10.2%, a difference of 0.51%).
| Demographics | Rating | Rank | Family Poverty |
| Sudanese | 3.1 /100 | #228 | Tragic 10.0% |
| Immigrants | Uzbekistan | 3.1 /100 | #229 | Tragic 10.0% |
| Immigrants | Panama | 3.1 /100 | #230 | Tragic 10.0% |
| Alaskan Athabascans | 2.7 /100 | #231 | Tragic 10.1% |
| Immigrants | Sudan | 2.3 /100 | #232 | Tragic 10.1% |
| Fijians | 2.1 /100 | #233 | Tragic 10.1% |
| Immigrants | Middle Africa | 2.1 /100 | #234 | Tragic 10.1% |
| Nigerians | 2.0 /100 | #235 | Tragic 10.1% |
| Immigrants | Nigeria | 1.9 /100 | #236 | Tragic 10.2% |
| Immigrants | Laos | 1.7 /100 | #237 | Tragic 10.2% |
| French American Indians | 1.5 /100 | #238 | Tragic 10.2% |
| Potawatomi | 1.5 /100 | #239 | Tragic 10.2% |
| Immigrants | Azores | 1.4 /100 | #240 | Tragic 10.3% |
| Ghanaians | 1.3 /100 | #241 | Tragic 10.3% |
| Alaska Natives | 1.0 /100 | #242 | Tragic 10.4% |
Demographics Similar to Immigrants from Malaysia by Family Poverty
In terms of family poverty, the demographic groups most similar to Immigrants from Malaysia are Chilean (8.5%, a difference of 0.040%), Immigrants from Brazil (8.5%, a difference of 0.040%), Sri Lankan (8.5%, a difference of 0.050%), Immigrants from Southern Europe (8.5%, a difference of 0.12%), and Armenian (8.5%, a difference of 0.52%).
| Demographics | Rating | Rank | Family Poverty |
| Argentineans | 89.6 /100 | #128 | Excellent 8.4% |
| Portuguese | 89.2 /100 | #129 | Excellent 8.4% |
| Immigrants | Bosnia and Herzegovina | 88.6 /100 | #130 | Excellent 8.4% |
| Puget Sound Salish | 88.6 /100 | #131 | Excellent 8.4% |
| Immigrants | Argentina | 88.2 /100 | #132 | Excellent 8.4% |
| Sri Lankans | 86.6 /100 | #133 | Excellent 8.5% |
| Chileans | 86.6 /100 | #134 | Excellent 8.5% |
| Immigrants | Malaysia | 86.5 /100 | #135 | Excellent 8.5% |
| Immigrants | Brazil | 86.3 /100 | #136 | Excellent 8.5% |
| Immigrants | Southern Europe | 86.0 /100 | #137 | Excellent 8.5% |
| Armenians | 84.6 /100 | #138 | Excellent 8.5% |
| Immigrants | Nepal | 84.2 /100 | #139 | Excellent 8.5% |
| Immigrants | Kazakhstan | 84.1 /100 | #140 | Excellent 8.5% |
| Immigrants | Ukraine | 83.9 /100 | #141 | Excellent 8.5% |
| Yugoslavians | 83.5 /100 | #142 | Excellent 8.5% |