French Canadian vs Immigrants from Malaysia Family Poverty
COMPARE
French Canadian
Immigrants from Malaysia
Family Poverty
Family Poverty Comparison
French Canadians
Immigrants from Malaysia
8.1%
FAMILY POVERTY
95.0/ 100
METRIC RATING
107th/ 347
METRIC RANK
8.5%
FAMILY POVERTY
86.5/ 100
METRIC RATING
135th/ 347
METRIC RANK
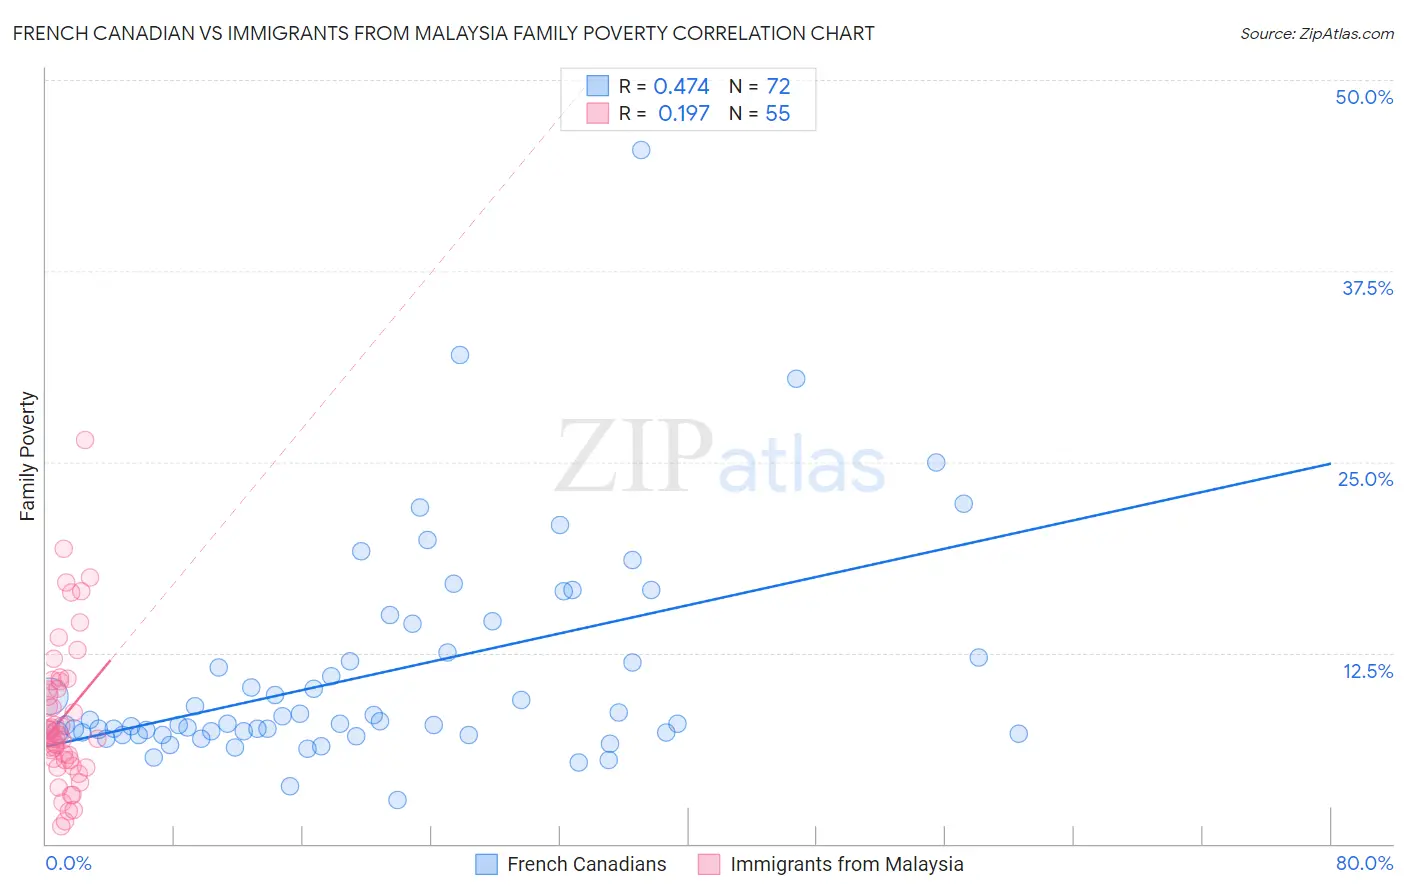
French Canadian vs Immigrants from Malaysia Family Poverty Correlation Chart
The statistical analysis conducted on geographies consisting of 499,881,871 people shows a moderate positive correlation between the proportion of French Canadians and poverty level among families in the United States with a correlation coefficient (R) of 0.474 and weighted average of 8.1%. Similarly, the statistical analysis conducted on geographies consisting of 197,782,180 people shows a poor positive correlation between the proportion of Immigrants from Malaysia and poverty level among families in the United States with a correlation coefficient (R) of 0.197 and weighted average of 8.5%, a difference of 4.0%.
Family Poverty Correlation Summary
| Measurement | French Canadian | Immigrants from Malaysia |
| Minimum | 2.9% | 1.1% |
| Maximum | 45.5% | 26.4% |
| Range | 42.6% | 25.3% |
| Mean | 11.1% | 8.3% |
| Median | 7.9% | 7.1% |
| Interquartile 25% (IQ1) | 7.2% | 5.4% |
| Interquartile 75% (IQ3) | 12.3% | 10.6% |
| Interquartile Range (IQR) | 5.1% | 5.2% |
| Standard Deviation (Sample) | 7.2% | 4.9% |
| Standard Deviation (Population) | 7.1% | 4.8% |
Similar Demographics by Family Poverty
Demographics Similar to French Canadians by Family Poverty
In terms of family poverty, the demographic groups most similar to French Canadians are Egyptian (8.1%, a difference of 0.040%), Basque (8.1%, a difference of 0.090%), Jordanian (8.2%, a difference of 0.18%), Romanian (8.2%, a difference of 0.27%), and Taiwanese (8.2%, a difference of 0.32%).
| Demographics | Rating | Rank | Family Poverty |
| New Zealanders | 95.8 /100 | #100 | Exceptional 8.1% |
| Immigrants | Norway | 95.7 /100 | #101 | Exceptional 8.1% |
| Immigrants | Indonesia | 95.7 /100 | #102 | Exceptional 8.1% |
| Immigrants | Eastern Europe | 95.6 /100 | #103 | Exceptional 8.1% |
| Slavs | 95.6 /100 | #104 | Exceptional 8.1% |
| Laotians | 95.6 /100 | #105 | Exceptional 8.1% |
| Egyptians | 95.1 /100 | #106 | Exceptional 8.1% |
| French Canadians | 95.0 /100 | #107 | Exceptional 8.1% |
| Basques | 94.9 /100 | #108 | Exceptional 8.1% |
| Jordanians | 94.8 /100 | #109 | Exceptional 8.2% |
| Romanians | 94.7 /100 | #110 | Exceptional 8.2% |
| Taiwanese | 94.6 /100 | #111 | Exceptional 8.2% |
| Immigrants | France | 94.4 /100 | #112 | Exceptional 8.2% |
| Canadians | 94.2 /100 | #113 | Exceptional 8.2% |
| Immigrants | Zimbabwe | 94.0 /100 | #114 | Exceptional 8.2% |
Demographics Similar to Immigrants from Malaysia by Family Poverty
In terms of family poverty, the demographic groups most similar to Immigrants from Malaysia are Chilean (8.5%, a difference of 0.040%), Immigrants from Brazil (8.5%, a difference of 0.040%), Sri Lankan (8.5%, a difference of 0.050%), Immigrants from Southern Europe (8.5%, a difference of 0.12%), and Armenian (8.5%, a difference of 0.52%).
| Demographics | Rating | Rank | Family Poverty |
| Argentineans | 89.6 /100 | #128 | Excellent 8.4% |
| Portuguese | 89.2 /100 | #129 | Excellent 8.4% |
| Immigrants | Bosnia and Herzegovina | 88.6 /100 | #130 | Excellent 8.4% |
| Puget Sound Salish | 88.6 /100 | #131 | Excellent 8.4% |
| Immigrants | Argentina | 88.2 /100 | #132 | Excellent 8.4% |
| Sri Lankans | 86.6 /100 | #133 | Excellent 8.5% |
| Chileans | 86.6 /100 | #134 | Excellent 8.5% |
| Immigrants | Malaysia | 86.5 /100 | #135 | Excellent 8.5% |
| Immigrants | Brazil | 86.3 /100 | #136 | Excellent 8.5% |
| Immigrants | Southern Europe | 86.0 /100 | #137 | Excellent 8.5% |
| Armenians | 84.6 /100 | #138 | Excellent 8.5% |
| Immigrants | Nepal | 84.2 /100 | #139 | Excellent 8.5% |
| Immigrants | Kazakhstan | 84.1 /100 | #140 | Excellent 8.5% |
| Immigrants | Ukraine | 83.9 /100 | #141 | Excellent 8.5% |
| Yugoslavians | 83.5 /100 | #142 | Excellent 8.5% |