Native/Alaskan vs Immigrants from Guatemala Seniors Poverty Over the Age of 65
COMPARE
Native/Alaskan
Immigrants from Guatemala
Seniors Poverty Over the Age of 65
Seniors Poverty Over the Age of 65 Comparison
Natives/Alaskans
Immigrants from Guatemala
14.2%
SENIORS POVERTY OVER THE AGE OF 65
0.0/ 100
METRIC RATING
311th/ 347
METRIC RANK
13.8%
SENIORS POVERTY OVER THE AGE OF 65
0.0/ 100
METRIC RATING
293rd/ 347
METRIC RANK
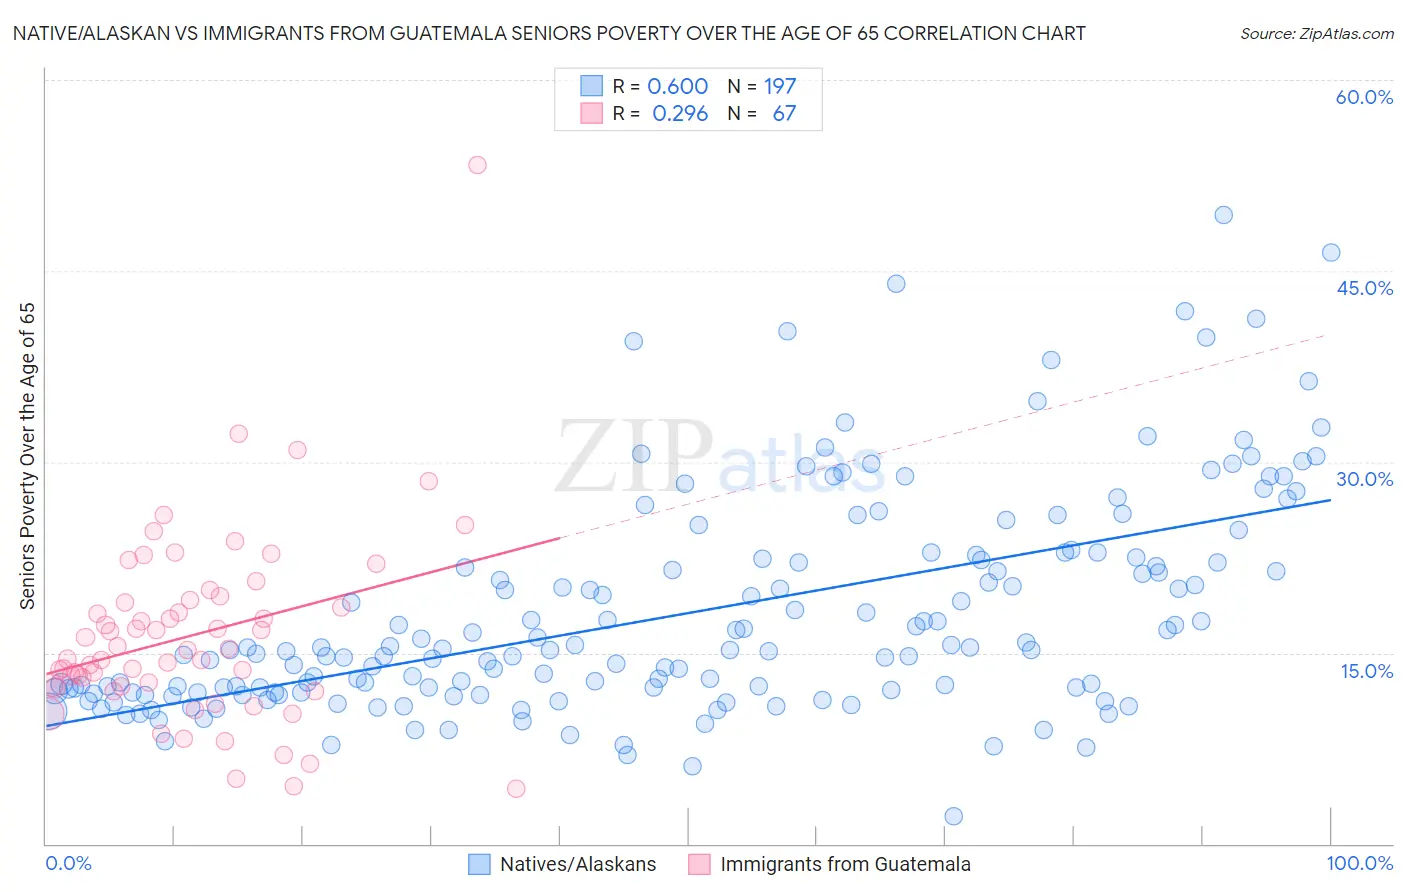
Native/Alaskan vs Immigrants from Guatemala Seniors Poverty Over the Age of 65 Correlation Chart
The statistical analysis conducted on geographies consisting of 510,101,075 people shows a substantial positive correlation between the proportion of Natives/Alaskans and poverty level among seniors over the age of 65 in the United States with a correlation coefficient (R) of 0.600 and weighted average of 14.2%. Similarly, the statistical analysis conducted on geographies consisting of 376,570,340 people shows a weak positive correlation between the proportion of Immigrants from Guatemala and poverty level among seniors over the age of 65 in the United States with a correlation coefficient (R) of 0.296 and weighted average of 13.8%, a difference of 3.0%.
Seniors Poverty Over the Age of 65 Correlation Summary
| Measurement | Native/Alaskan | Immigrants from Guatemala |
| Minimum | 2.2% | 4.3% |
| Maximum | 49.4% | 53.3% |
| Range | 47.2% | 49.0% |
| Mean | 18.1% | 16.4% |
| Median | 15.2% | 15.2% |
| Interquartile 25% (IQ1) | 11.9% | 12.4% |
| Interquartile 75% (IQ3) | 22.3% | 19.1% |
| Interquartile Range (IQR) | 10.4% | 6.7% |
| Standard Deviation (Sample) | 8.6% | 7.5% |
| Standard Deviation (Population) | 8.6% | 7.4% |
Demographics Similar to Natives/Alaskans and Immigrants from Guatemala by Seniors Poverty Over the Age of 65
In terms of seniors poverty over the age of 65, the demographic groups most similar to Natives/Alaskans are Bahamian (14.2%, a difference of 0.010%), Honduran (14.2%, a difference of 0.27%), Trinidadian and Tobagonian (14.2%, a difference of 0.36%), Immigrants from West Indies (14.2%, a difference of 0.44%), and Hispanic or Latino (14.3%, a difference of 0.54%). Similarly, the demographic groups most similar to Immigrants from Guatemala are Spanish American Indian (13.8%, a difference of 0.19%), Cheyenne (13.9%, a difference of 0.42%), Apache (13.9%, a difference of 0.61%), Immigrants from Jamaica (13.9%, a difference of 0.88%), and Vietnamese (14.0%, a difference of 0.95%).
| Demographics | Rating | Rank | Seniors Poverty Over the Age of 65 |
| Spanish American Indians | 0.0 /100 | #292 | Tragic 13.8% |
| Immigrants | Guatemala | 0.0 /100 | #293 | Tragic 13.8% |
| Cheyenne | 0.0 /100 | #294 | Tragic 13.9% |
| Apache | 0.0 /100 | #295 | Tragic 13.9% |
| Immigrants | Jamaica | 0.0 /100 | #296 | Tragic 13.9% |
| Vietnamese | 0.0 /100 | #297 | Tragic 14.0% |
| Immigrants | Belize | 0.0 /100 | #298 | Tragic 14.0% |
| Ecuadorians | 0.0 /100 | #299 | Tragic 14.0% |
| Immigrants | Uzbekistan | 0.0 /100 | #300 | Tragic 14.0% |
| U.S. Virgin Islanders | 0.0 /100 | #301 | Tragic 14.0% |
| Yup'ik | 0.0 /100 | #302 | Tragic 14.1% |
| Immigrants | Bangladesh | 0.0 /100 | #303 | Tragic 14.1% |
| West Indians | 0.0 /100 | #304 | Tragic 14.1% |
| Immigrants | Trinidad and Tobago | 0.0 /100 | #305 | Tragic 14.1% |
| Immigrants | Latin America | 0.0 /100 | #306 | Tragic 14.2% |
| Immigrants | West Indies | 0.0 /100 | #307 | Tragic 14.2% |
| Trinidadians and Tobagonians | 0.0 /100 | #308 | Tragic 14.2% |
| Hondurans | 0.0 /100 | #309 | Tragic 14.2% |
| Bahamians | 0.0 /100 | #310 | Tragic 14.2% |
| Natives/Alaskans | 0.0 /100 | #311 | Tragic 14.2% |
| Hispanics or Latinos | 0.0 /100 | #312 | Tragic 14.3% |