Native Hawaiian vs Immigrants from Lebanon Seniors Poverty Over the Age of 75
COMPARE
Native Hawaiian
Immigrants from Lebanon
Seniors Poverty Over the Age of 75
Seniors Poverty Over the Age of 75 Comparison
Native Hawaiians
Immigrants from Lebanon
10.1%
SENIORS POVERTY OVER THE AGE OF 75
100.0/ 100
METRIC RATING
3rd/ 347
METRIC RANK
12.7%
SENIORS POVERTY OVER THE AGE OF 75
12.7/ 100
METRIC RATING
199th/ 347
METRIC RANK
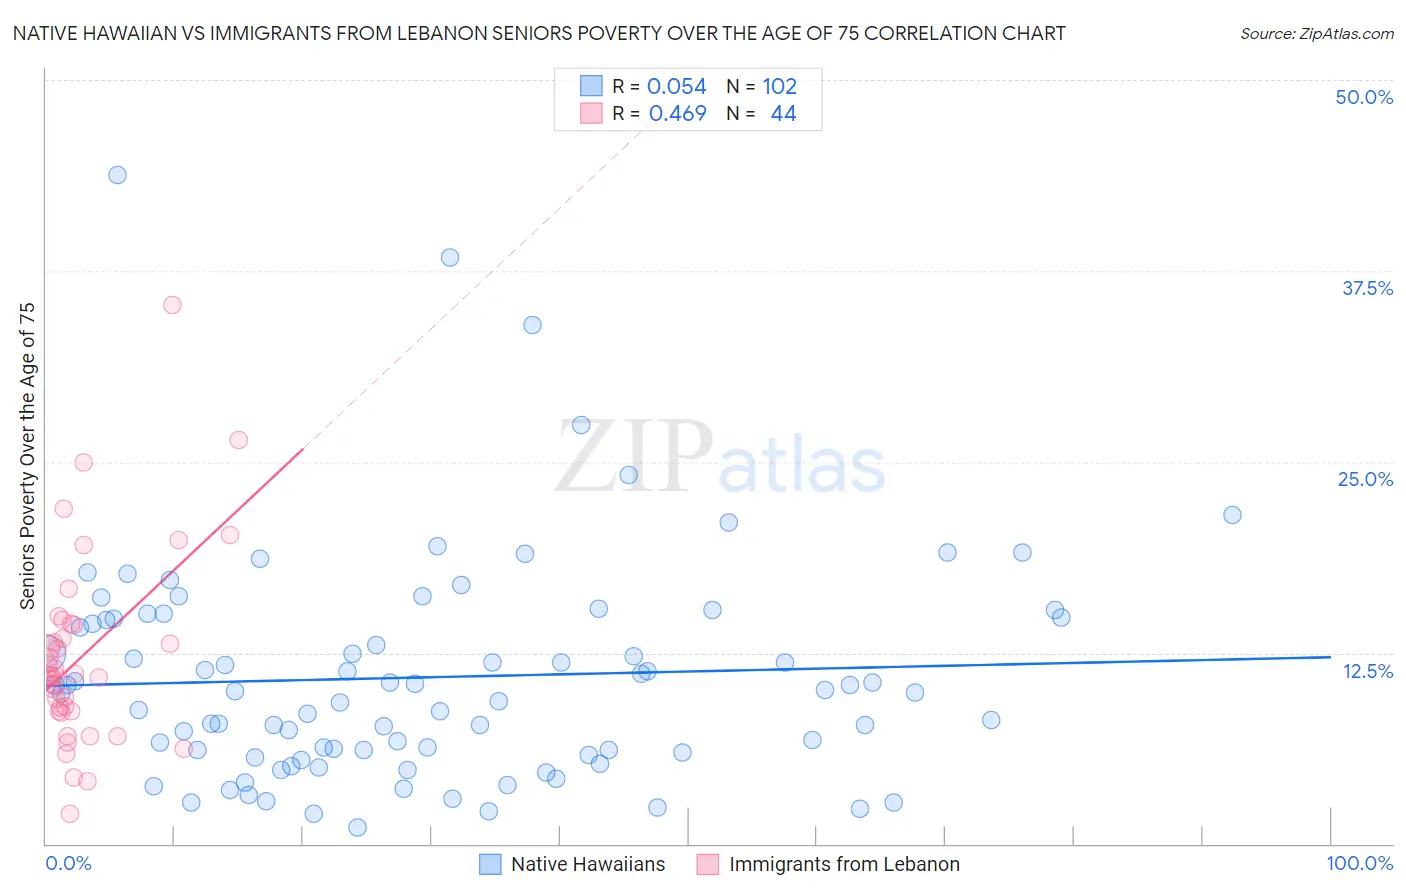
Native Hawaiian vs Immigrants from Lebanon Seniors Poverty Over the Age of 75 Correlation Chart
The statistical analysis conducted on geographies consisting of 328,398,579 people shows a slight positive correlation between the proportion of Native Hawaiians and poverty level among seniors over the age of 75 in the United States with a correlation coefficient (R) of 0.054 and weighted average of 10.1%. Similarly, the statistical analysis conducted on geographies consisting of 215,969,018 people shows a moderate positive correlation between the proportion of Immigrants from Lebanon and poverty level among seniors over the age of 75 in the United States with a correlation coefficient (R) of 0.469 and weighted average of 12.7%, a difference of 25.8%.
Seniors Poverty Over the Age of 75 Correlation Summary
| Measurement | Native Hawaiian | Immigrants from Lebanon |
| Minimum | 1.1% | 2.0% |
| Maximum | 43.8% | 35.3% |
| Range | 42.7% | 33.3% |
| Mean | 10.9% | 12.4% |
| Median | 9.9% | 11.0% |
| Interquartile 25% (IQ1) | 6.0% | 8.7% |
| Interquartile 75% (IQ3) | 14.7% | 14.4% |
| Interquartile Range (IQR) | 8.7% | 5.7% |
| Standard Deviation (Sample) | 7.3% | 6.3% |
| Standard Deviation (Population) | 7.3% | 6.3% |
Similar Demographics by Seniors Poverty Over the Age of 75
Demographics Similar to Native Hawaiians by Seniors Poverty Over the Age of 75
In terms of seniors poverty over the age of 75, the demographic groups most similar to Native Hawaiians are Swedish (10.2%, a difference of 0.85%), Norwegian (10.2%, a difference of 1.3%), Danish (10.2%, a difference of 1.5%), Maltese (10.3%, a difference of 2.2%), and German (10.4%, a difference of 2.8%).
| Demographics | Rating | Rank | Seniors Poverty Over the Age of 75 |
| Chinese | 100.0 /100 | #1 | Exceptional 9.1% |
| Tlingit-Haida | 100.0 /100 | #2 | Exceptional 9.7% |
| Native Hawaiians | 100.0 /100 | #3 | Exceptional 10.1% |
| Swedes | 100.0 /100 | #4 | Exceptional 10.2% |
| Norwegians | 100.0 /100 | #5 | Exceptional 10.2% |
| Danes | 100.0 /100 | #6 | Exceptional 10.2% |
| Maltese | 100.0 /100 | #7 | Exceptional 10.3% |
| Germans | 99.9 /100 | #8 | Exceptional 10.4% |
| English | 99.9 /100 | #9 | Exceptional 10.4% |
| Scandinavians | 99.9 /100 | #10 | Exceptional 10.4% |
| Immigrants | India | 99.9 /100 | #11 | Exceptional 10.4% |
| Tongans | 99.9 /100 | #12 | Exceptional 10.5% |
| Croatians | 99.9 /100 | #13 | Exceptional 10.5% |
| Scottish | 99.9 /100 | #14 | Exceptional 10.5% |
| Europeans | 99.9 /100 | #15 | Exceptional 10.5% |
Demographics Similar to Immigrants from Lebanon by Seniors Poverty Over the Age of 75
In terms of seniors poverty over the age of 75, the demographic groups most similar to Immigrants from Lebanon are Immigrants from Vietnam (12.7%, a difference of 0.10%), Chilean (12.6%, a difference of 0.17%), Nepalese (12.6%, a difference of 0.28%), Paraguayan (12.7%, a difference of 0.30%), and Arapaho (12.7%, a difference of 0.33%).
| Demographics | Rating | Rank | Seniors Poverty Over the Age of 75 |
| Choctaw | 20.2 /100 | #192 | Fair 12.5% |
| Taiwanese | 17.8 /100 | #193 | Poor 12.6% |
| Alsatians | 17.7 /100 | #194 | Poor 12.6% |
| Immigrants | France | 17.4 /100 | #195 | Poor 12.6% |
| Immigrants | Eastern Europe | 16.0 /100 | #196 | Poor 12.6% |
| Nepalese | 14.4 /100 | #197 | Poor 12.6% |
| Chileans | 13.7 /100 | #198 | Poor 12.6% |
| Immigrants | Lebanon | 12.7 /100 | #199 | Poor 12.7% |
| Immigrants | Vietnam | 12.1 /100 | #200 | Poor 12.7% |
| Paraguayans | 11.1 /100 | #201 | Poor 12.7% |
| Arapaho | 10.9 /100 | #202 | Poor 12.7% |
| Immigrants | Southern Europe | 10.7 /100 | #203 | Poor 12.7% |
| Immigrants | Eritrea | 10.5 /100 | #204 | Poor 12.7% |
| Indians (Asian) | 9.7 /100 | #205 | Tragic 12.7% |
| Albanians | 9.6 /100 | #206 | Tragic 12.7% |