Native Hawaiian vs Slovak Seniors Poverty Over the Age of 75
COMPARE
Native Hawaiian
Slovak
Seniors Poverty Over the Age of 75
Seniors Poverty Over the Age of 75 Comparison
Native Hawaiians
Slovaks
10.1%
SENIORS POVERTY OVER THE AGE OF 75
100.0/ 100
METRIC RATING
3rd/ 347
METRIC RANK
10.5%
SENIORS POVERTY OVER THE AGE OF 75
99.9/ 100
METRIC RATING
17th/ 347
METRIC RANK
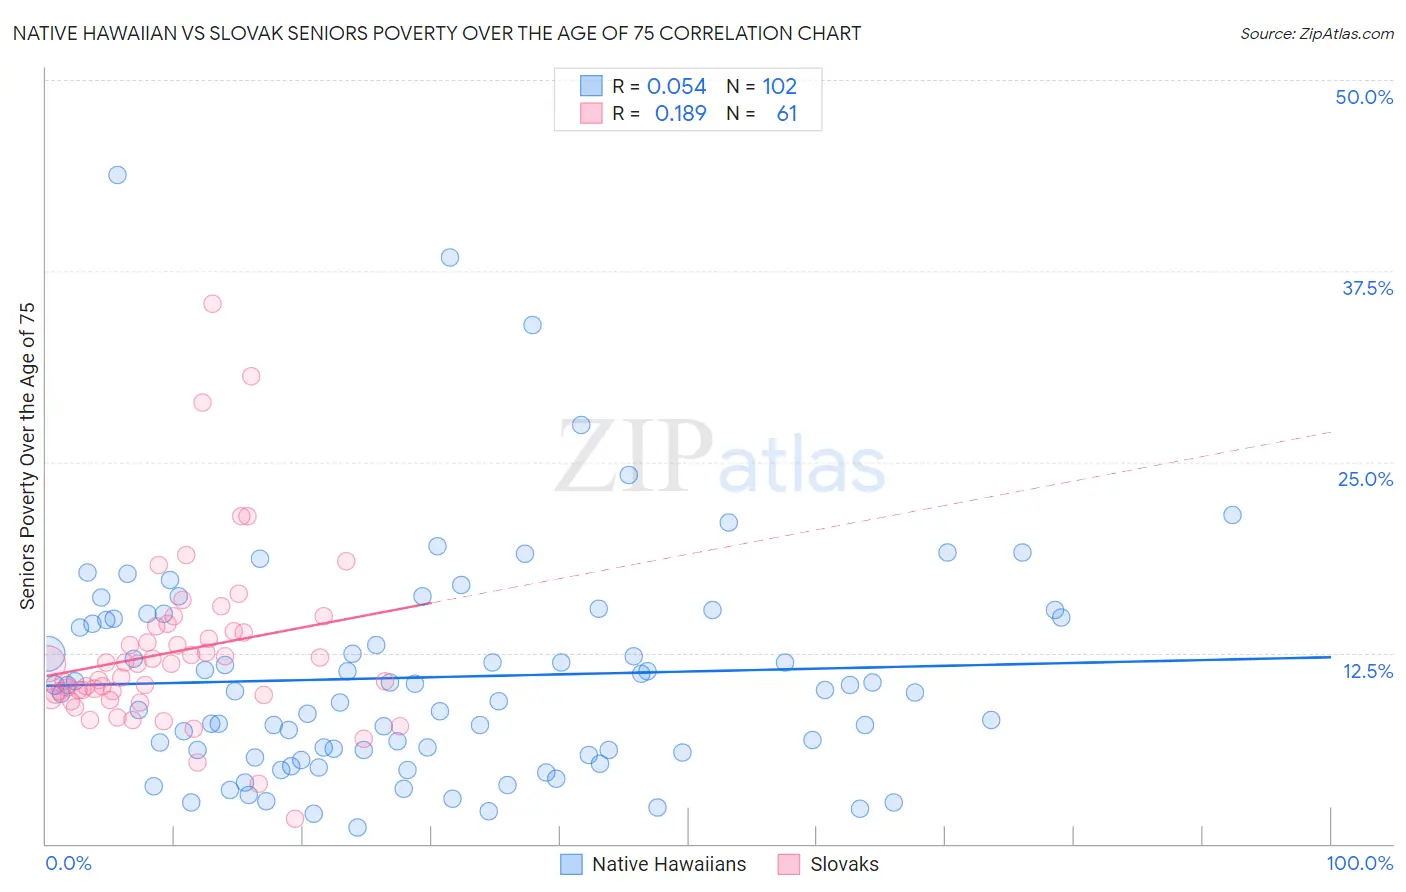
Native Hawaiian vs Slovak Seniors Poverty Over the Age of 75 Correlation Chart
The statistical analysis conducted on geographies consisting of 328,398,579 people shows a slight positive correlation between the proportion of Native Hawaiians and poverty level among seniors over the age of 75 in the United States with a correlation coefficient (R) of 0.054 and weighted average of 10.1%. Similarly, the statistical analysis conducted on geographies consisting of 392,230,662 people shows a poor positive correlation between the proportion of Slovaks and poverty level among seniors over the age of 75 in the United States with a correlation coefficient (R) of 0.189 and weighted average of 10.5%, a difference of 4.7%.
Seniors Poverty Over the Age of 75 Correlation Summary
| Measurement | Native Hawaiian | Slovak |
| Minimum | 1.1% | 1.7% |
| Maximum | 43.8% | 35.3% |
| Range | 42.7% | 33.7% |
| Mean | 10.9% | 12.6% |
| Median | 9.9% | 11.8% |
| Interquartile 25% (IQ1) | 6.0% | 9.6% |
| Interquartile 75% (IQ3) | 14.7% | 14.1% |
| Interquartile Range (IQR) | 8.7% | 4.4% |
| Standard Deviation (Sample) | 7.3% | 5.7% |
| Standard Deviation (Population) | 7.3% | 5.7% |
Demographics Similar to Native Hawaiians and Slovaks by Seniors Poverty Over the Age of 75
In terms of seniors poverty over the age of 75, the demographic groups most similar to Native Hawaiians are Swedish (10.2%, a difference of 0.85%), Norwegian (10.2%, a difference of 1.3%), Danish (10.2%, a difference of 1.5%), Maltese (10.3%, a difference of 2.2%), and German (10.4%, a difference of 2.8%). Similarly, the demographic groups most similar to Slovaks are Welsh (10.5%, a difference of 0.010%), Immigrants from Scotland (10.5%, a difference of 0.040%), Czech (10.5%, a difference of 0.060%), Dutch (10.5%, a difference of 0.21%), and Scottish (10.5%, a difference of 0.32%).
| Demographics | Rating | Rank | Seniors Poverty Over the Age of 75 |
| Chinese | 100.0 /100 | #1 | Exceptional 9.1% |
| Tlingit-Haida | 100.0 /100 | #2 | Exceptional 9.7% |
| Native Hawaiians | 100.0 /100 | #3 | Exceptional 10.1% |
| Swedes | 100.0 /100 | #4 | Exceptional 10.2% |
| Norwegians | 100.0 /100 | #5 | Exceptional 10.2% |
| Danes | 100.0 /100 | #6 | Exceptional 10.2% |
| Maltese | 100.0 /100 | #7 | Exceptional 10.3% |
| Germans | 99.9 /100 | #8 | Exceptional 10.4% |
| English | 99.9 /100 | #9 | Exceptional 10.4% |
| Scandinavians | 99.9 /100 | #10 | Exceptional 10.4% |
| Immigrants | India | 99.9 /100 | #11 | Exceptional 10.4% |
| Tongans | 99.9 /100 | #12 | Exceptional 10.5% |
| Croatians | 99.9 /100 | #13 | Exceptional 10.5% |
| Scottish | 99.9 /100 | #14 | Exceptional 10.5% |
| Europeans | 99.9 /100 | #15 | Exceptional 10.5% |
| Dutch | 99.9 /100 | #16 | Exceptional 10.5% |
| Slovaks | 99.9 /100 | #17 | Exceptional 10.5% |
| Welsh | 99.9 /100 | #18 | Exceptional 10.5% |
| Immigrants | Scotland | 99.9 /100 | #19 | Exceptional 10.5% |
| Czechs | 99.9 /100 | #20 | Exceptional 10.5% |